Health Care and Medical Properties
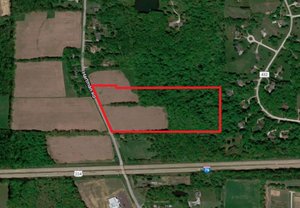
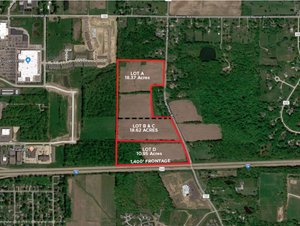
959 East 144th Street Cleveland, OH 44110
959 East 144th Street Cleveland, OH 44110

Details & Description
Listing Agents

Nancy Ferrante
M: 216-525-1496
nferrante@crescorealestate.com
M: 216-525-1496
nferrante@crescorealestate.com
While we strive to provide the most accurate information, all listing information, and demographic data, is provided by third-parties. As such, MyEListing will not be responsible for the accuracy of the information. It is strongly recommended that you verify all information with the listing agent, and any relevant agencies, prior to making any decisions.