Highlights
Incredible OUTDOOR Patio space
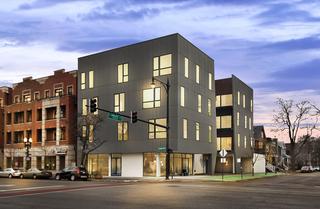
High Visibility Corner
Frontage on Irving Park + Oakley
High Ceilings
Amazing Window Line
Description
Jameson Commercial is pleased to present 1,430 square feet of Prime Ground-floor CORNER RETAIL SPACE located at the base of a NEW Luxury Mixed-Use Development in Chicago's North Center. Perfect for Cafe, QS, or Fast Casual Restaraunt use! Incredible Visibility with frontage on the inbound side of the highly trafficked Irving Park Road (26,700 Vehicles Per Day). Up to 1,190 square feet of private OUTDOOR Space available. 2,600 ft from the CTA Brownline at Irving Park. Two miles to Lakeshore Drive and just over two miles to the Kennedy Expressway (I90). This property enjoys proximity to Chicago's best public and private schools, drawing affluent families to the neighborhood.
Location
AREA HIGHLIGHTS
• Near Chicago's best public & private schools
• High Average Household Income
• Area Medical Tenants.
$28.00 SF/yr $6 SF/yr 1,430 SF 2018
AREA TENANTS
• Walgreens
• Advocate Medical
• CVS
• Dunkin Donuts
• Chicago Joe's • Starbucks
• O'Donovan's
• Globe
TRANSPORTATION HIGHLIGHTS
• 26,700 Vehicles Per Day
• Easy Access to CTA Brown, Kennedy Expressway + Lakeshore Dr.
No part of this information may be copied, reproduced, repurposed, or screen-captured for any commercial purpose without prior written authorization from MyEListing.
While we strive to provide the most accurate information, all listing information, and demographic data, is provided by third-parties. As such, MyEListing will not be responsible for the accuracy of the information. It is strongly recommended that you verify all information with the listing agent, and any relevant agencies, prior to making any decisions.
What is the asking price for 2257 West Irving Park Road in Chicago?
The asking price for 2257 West Irving Park Road is $26.00 a SF per Year
What is the building size of this commercial Retail property?
The size of this lease property at '.2257 West Irving Park Road.' is 1430 square feet
What kind of Retail is the propery at 2257 West Irving Park Road?
The property at 2257 West Irving Park Road Chicago, IL 60618 is listed as a Other Retail Retail property
What is the population within 1 mile of 2257 West Irving Park Road in Chicago?
The population within 1 mile of 2257 West Irving Park Road Chicago, IL 60618 is 57,224 people.
Who do I contact for questions about 2257 West Irving Park Road?
You should contact the listing agent,
Hunter Cannon, for any details regarding this commercial listing.