Industrial Properties
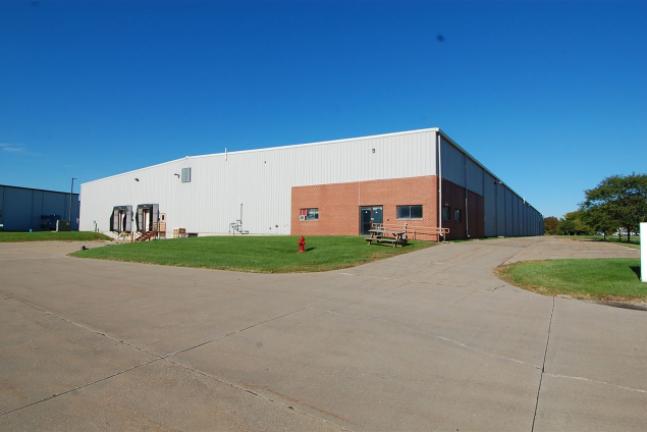
2239 Heinz Road Iowa City, IA 52240
2239 Heinz Road Iowa City, IA 52240
Details & Description
Listing Agents

Jeff Edberg
O: 319-248-0509
M: 319-331-6187
jeff@icrealestate.com
O: 319-248-0509
M: 319-331-6187
jeff@icrealestate.com
While we strive to provide the most accurate information, all listing information, and demographic data, is provided by third-parties. As such, MyEListing will not be responsible for the accuracy of the information. It is strongly recommended that you verify all information with the listing agent, and any relevant agencies, prior to making any decisions.


