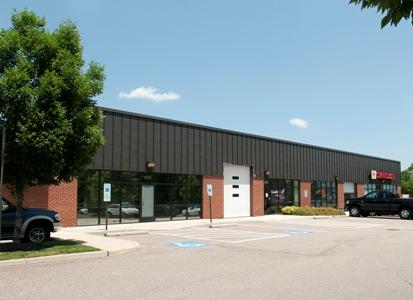
1-Mile | 3-Miles | 5-Miles | ||
---|---|---|---|---|
Total Population | 11,413 | 52,577 | 118,023 | |
Population Median Age | 41 | 40 | 39 | |
Population by Age | 0-9 Yrs | 1508 (13%) | 6482 (12%) | 15153 (12%) |
10-19 Yrs | 1352 (11%) | 6295 (11%) | 14946 (12%) | |
20-29 Yrs | 1122 (9%) | 5743 (10%) | 14621 (12%) | |
30-39 Yrs | 1281 (11%) | 6503 (12%) | 15844 (13%) | |
40-49 Yrs | 1598 (14%) | 7291 (13%) | 16102 (13%) | |
50-59 Yrs | 1412 (12%) | 7773 (14%) | 16105 (13%) | |
60-69 Yrs | 1481 (12%) | 6348 (12%) | 13282 (11%) | |
70+ Yrs | 1659 (14%) | 6141 (11%) | 11970 (10%) | |
Median HH Income | $73,672 | $94,679 | $90,736 | |
Total Household Income | < 24K | 621 (13%) | 1979 (9%) | 4943 (10%) |
25-49K | 999 (20%) | 3005 (14%) | 7094 (15%) | |
50-74K | 813 (17%) | 3002 (14%) | 6699 (14%) | |
75-99K | 847 (17%) | 3220 (15%) | 6876 (14%) | |
100-199K | 1133 (23%) | 6372 (30%) | 12749 (27%) | |
200K+ | 362 (7%) | 3464 (16%) | 7768 (16%) | |
Highest Education Level | No Diploma | 366 | 1141 | 3501 |
Diploma or GED | 1336 | 4935 | 10877 | |
Some College | 1727 | 5916 | 12853 | |
Assoc. Degree | 471 | 2119 | 5252 | |
Bachelors Degree | 2579 | 13738 | 28870 | |
Higher Degree | 1544 | 9409 | 20457 | |
Total Housing Units | 5,052 | 22,248 | 49,039 | |
--Owner-Occupied | 2,888 | 13,603 | 28,365 | |
--Renter-Occupied | 1,888 | 7,438 | 17,764 | |
Owner-Occupied Values | < 100K | 41 | 149 | 375 |
100-199K | 602 | 1602 | 3371 | |
200-299K | 1187 | 3589 | 6683 | |
300-399K | 678 | 3837 | 6660 | |
400-499K | 242 | 1869 | 4269 | |
500K+ | 138 | 2557 | 7008 | |
Total Working Age Population | 9,043 | 41,959 | 92,999 | |
In Work Force | 5,892 | 28,976 | 64,593 | |
Not In Work Force | 3,151 | 12,984 | 28,405 | |
Workforce Employed | 5,533 | 27,857 | 62,027 | |
Workforce Unemployed | 359 | 1,067 | 2,441 | |
Civlian Workforce | 5,892 | 28,923 | 64,468 | |
Military Workforce | 0 | 52 | 126 | |
Total Households | 4,776 | 21,042 | 46,129 | |
Family Households | 2,704 | 13,345 | 30,401 | |
Non-Family Households | 2,073 | 7,697 | 15,729 | |
Married Couple | 2,111 | 11,504 | 25,337 | |
Other Family | 593 | 1,841 | 5,064 | |
Married w/Child | 987 | 5,330 | 11,588 | |
Single Male w/Child | 77 | 174 | 667 | |
Single Female w/Child | 242 | 731 | 1,949 |
Population Change Last Two Decades - Plus Projection
2000 | % | 2010 | % | 2020 | % | 2030 | |
---|---|---|---|---|---|---|---|
Virginia | 7,078,515 | +13 | 8,001,024 | +8 | 8,655,021 | +8 | 9,331,666 |
Chesterfield County | 259,903 | +22 | 316,236 | +12 | 353,841 | +12 | 396,647 |
Goochland County | 16,863 | +29 | 21,717 | +8 | 23,547 | +13 | 26,702 |
Hanover County | 86,320 | +16 | 99,863 | +9 | 109,244 | +9 | 119,360 |
Henrico County | 262,300 | +17 | 306,935 | +8 | 332,103 | +9 | 363,259 |
Powhatan County | 22,377 | +25 | 28,046 | +7 | 29,909 | +12 | 33,440 |
Richmond city | 197,790 | +3 | 204,214 | +14 | 232,533 | +6 | 245,483 |
Total Working Age Population:
Total Households:
Total Working Age Population:
Total Households:
Total Working Age Population:
Total Households: