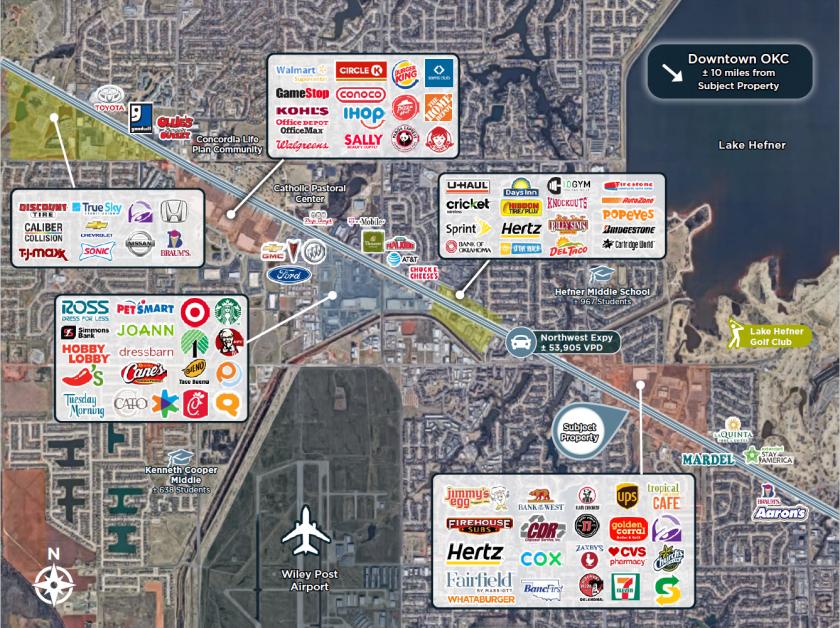
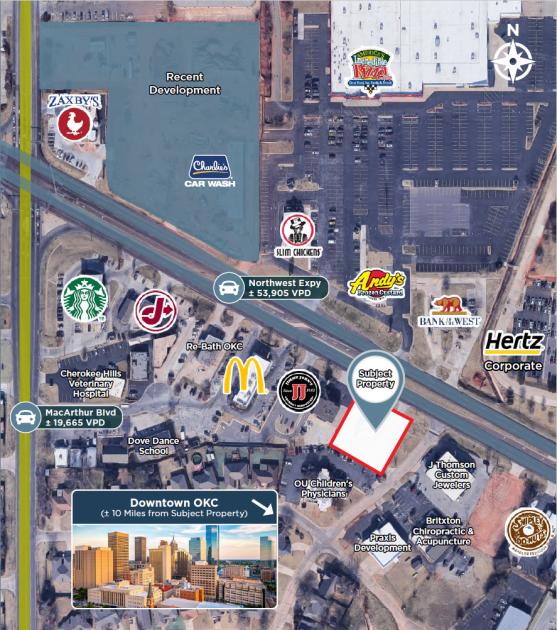
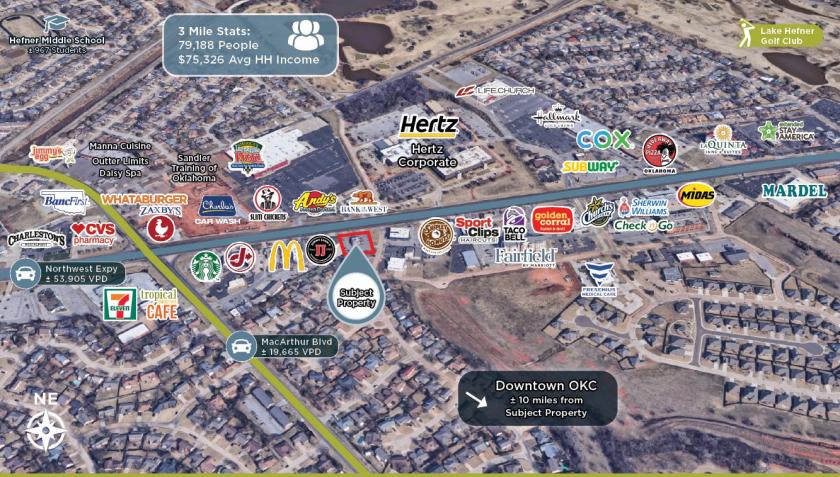
1-Mile | 3-Miles | 5-Miles | ||
---|---|---|---|---|
Total Population | 8,992 | 81,928 | 235,091 | |
Population Median Age | 38 | 39 | 38 | |
Population by Age | 0-9 Yrs | 1391 (15%) | 10535 (12%) | 31399 (13%) |
10-19 Yrs | 1054 (11%) | 9316 (11%) | 26819 (11%) | |
20-29 Yrs | 1357 (15%) | 12231 (14%) | 37694 (16%) | |
30-39 Yrs | 1189 (13%) | 11438 (13%) | 35466 (15%) | |
40-49 Yrs | 1059 (11%) | 9405 (11%) | 26769 (11%) | |
50-59 Yrs | 919 (10%) | 9457 (11%) | 26824 (11%) | |
60-69 Yrs | 920 (10%) | 9771 (11%) | 25996 (11%) | |
70+ Yrs | 1104 (12%) | 9775 (11%) | 24125 (10%) | |
Median HH Income | $54,281 | $54,784 | $55,046 | |
Total Household Income | < 24K | 587 (17%) | 6815 (19%) | 19223 (19%) |
25-49K | 992 (29%) | 8930 (25%) | 25662 (25%) | |
50-74K | 621 (18%) | 6621 (19%) | 19467 (19%) | |
75-99K | 369 (10%) | 4155 (12%) | 12108 (12%) | |
100-199K | 702 (20%) | 6121 (17%) | 17034 (17%) | |
200K+ | 114 (3%) | 1747 (5%) | 5315 (5%) | |
Highest Education Level | No Diploma | 457 | 4742 | 15296 |
Diploma or GED | 1548 | 13576 | 37932 | |
Some College | 1481 | 14260 | 38700 | |
Assoc. Degree | 493 | 4232 | 11722 | |
Bachelors Degree | 1458 | 13686 | 38190 | |
Higher Degree | 538 | 6457 | 19852 | |
Total Housing Units | 3,899 | 39,061 | 111,084 | |
--Owner-Occupied | 2,078 | 19,747 | 56,233 | |
--Renter-Occupied | 1,308 | 14,641 | 42,577 | |
Owner-Occupied Values | < 100K | 130 | 3203 | 11289 |
100-199K | 1542 | 11160 | 28318 | |
200-299K | 359 | 3595 | 9168 | |
300-399K | 42 | 854 | 2926 | |
400-499K | 0 | 430 | 1511 | |
500K+ | 6 | 505 | 3020 | |
Total Working Age Population | 6,888 | 65,911 | 186,807 | |
In Work Force | 4,539 | 44,443 | 128,419 | |
Not In Work Force | 2,349 | 21,468 | 58,388 | |
Workforce Employed | 4,296 | 42,434 | 122,989 | |
Workforce Unemployed | 237 | 1,866 | 5,110 | |
Civlian Workforce | 4,533 | 44,300 | 128,099 | |
Military Workforce | 7 | 143 | 319 | |
Total Households | 3,385 | 34,389 | 98,809 | |
Family Households | 2,298 | 19,698 | 55,392 | |
Non-Family Households | 1,087 | 14,691 | 43,418 | |
Married Couple | 1,622 | 13,268 | 38,414 | |
Other Family | 677 | 6,430 | 16,978 | |
Married w/Child | 640 | 4,277 | 14,239 | |
Single Male w/Child | 39 | 795 | 2,217 | |
Single Female w/Child | 308 | 2,765 | 7,570 |
Population Change Last Two Decades - Plus Projection
2000 | % | 2010 | % | 2020 | % | 2030 | |
---|---|---|---|---|---|---|---|
Oklahoma | 3,450,654 | +9 | 3,751,351 | +7 | 4,024,202 | +7 | 4,302,501 |
Canadian County | 87,697 | +32 | 115,541 | +16 | 133,468 | +13 | 151,440 |
Oklahoma County | 660,448 | +9 | 718,633 | +7 | 772,053 | +6 | 821,230 |
Total Working Age Population:
Total Households:
Total Working Age Population:
Total Households:
Total Working Age Population:
Total Households: