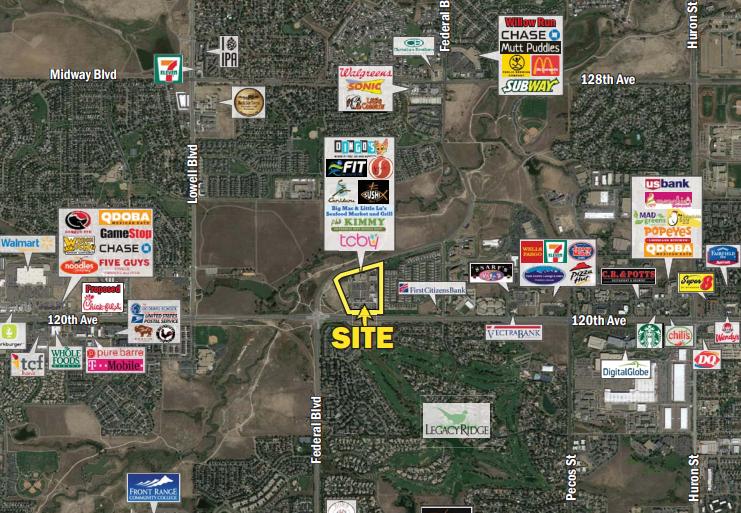
1-Mile | 3-Miles | 5-Miles | ||
---|---|---|---|---|
Total Population | 10,165 | 120,970 | 298,293 | |
Population Median Age | 39 | 37 | 36 | |
Population by Age | 0-9 Yrs | 1072 (10%) | 16480 (13%) | 41304 (13%) |
10-19 Yrs | 1407 (13%) | 15825 (13%) | 40652 (13%) | |
20-29 Yrs | 1189 (11%) | 16332 (13%) | 42974 (14%) | |
30-39 Yrs | 1540 (15%) | 18755 (15%) | 47256 (15%) | |
40-49 Yrs | 1570 (15%) | 16737 (13%) | 39042 (13%) | |
50-59 Yrs | 1275 (12%) | 16115 (13%) | 37849 (12%) | |
60-69 Yrs | 1342 (13%) | 11388 (9%) | 27218 (9%) | |
70+ Yrs | 771 (7%) | 9338 (7%) | 21997 (7%) | |
Median HH Income | $97,734 | $83,778 | $77,638 | |
Total Household Income | < 24K | 359 (8%) | 4404 (9%) | 11545 (10%) |
25-49K | 661 (16%) | 7930 (17%) | 20225 (18%) | |
50-74K | 580 (14%) | 7783 (17%) | 20662 (19%) | |
75-99K | 493 (12%) | 6286 (14%) | 16462 (15%) | |
100-199K | 1346 (32%) | 13537 (30%) | 30437 (28%) | |
200K+ | 658 (16%) | 4709 (10%) | 9008 (8%) | |
Highest Education Level | No Diploma | 175 | 6015 | 20270 |
Diploma or GED | 1210 | 17682 | 46325 | |
Some College | 1383 | 17886 | 43351 | |
Assoc. Degree | 643 | 7506 | 18045 | |
Bachelors Degree | 2190 | 20642 | 45674 | |
Higher Degree | 1498 | 11808 | 23811 | |
Total Housing Units | 4,263 | 46,110 | 112,227 | |
--Owner-Occupied | 2,787 | 30,299 | 70,893 | |
--Renter-Occupied | 1,311 | 14,350 | 37,447 | |
Owner-Occupied Values | < 100K | 91 | 1973 | 4870 |
100-199K | 64 | 1741 | 4962 | |
200-299K | 257 | 5933 | 17153 | |
300-399K | 910 | 9535 | 22659 | |
400-499K | 645 | 5102 | 10720 | |
500K+ | 819 | 6016 | 10528 | |
Total Working Age Population | 8,162 | 94,435 | 231,509 | |
In Work Force | 5,937 | 68,729 | 169,421 | |
Not In Work Force | 2,226 | 25,706 | 62,088 | |
Workforce Employed | 5,773 | 66,419 | 163,064 | |
Workforce Unemployed | 148 | 2,222 | 6,167 | |
Civlian Workforce | 5,921 | 68,641 | 169,232 | |
Military Workforce | 15 | 88 | 189 | |
Total Households | 4,098 | 44,649 | 108,340 | |
Family Households | 2,797 | 30,808 | 73,050 | |
Non-Family Households | 1,300 | 13,841 | 35,289 | |
Married Couple | 2,331 | 23,911 | 55,250 | |
Other Family | 466 | 6,898 | 17,800 | |
Married w/Child | 997 | 10,741 | 24,737 | |
Single Male w/Child | 32 | 991 | 3,080 | |
Single Female w/Child | 212 | 2,529 | 6,715 |
Population Change Last Two Decades - Plus Projection
2000 | % | 2010 | % | 2020 | % | 2030 | |
---|---|---|---|---|---|---|---|
Colorado | 4,301,261 | +17 | 5,029,196 | +16 | 5,838,181 | +15 | 6,733,658 |
Adams County | 363,857 | +21 | 441,603 | +20 | 530,680 | +21 | 642,318 |
Boulder County | 291,288 | +1 | 294,567 | +13 | 332,134 | +12 | 370,618 |
Broomfield County | 0 | 55,889 | +32 | 73,822 | +28 | 94,282 | |
Denver County | 554,636 | +8 | 600,158 | +23 | 738,611 | +12 | 827,681 |
Jefferson County | 527,056 | +1 | 534,543 | +10 | 587,118 | +7 | 626,742 |
Total Working Age Population:
Total Households:
Total Working Age Population:
Total Households:
Total Working Age Population:
Total Households: