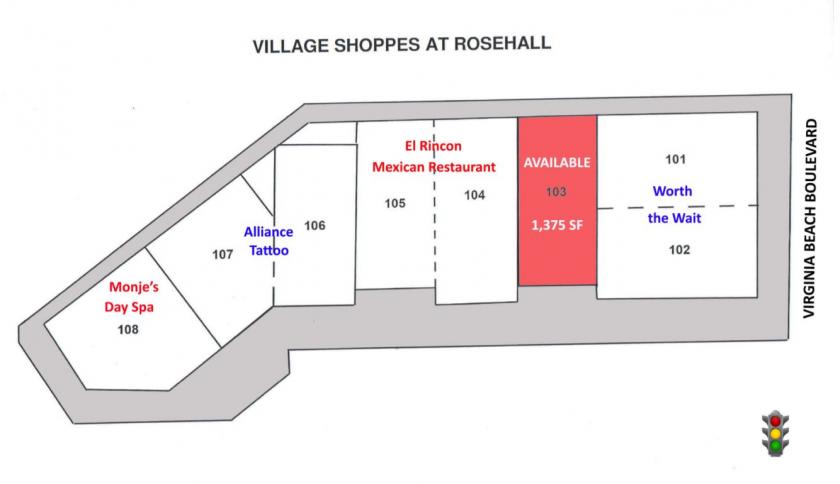
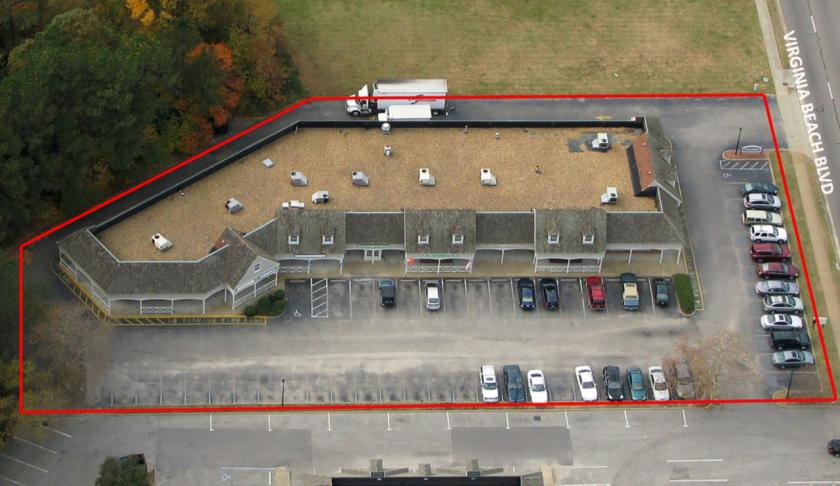
1-Mile | 3-Miles | 5-Miles | ||
---|---|---|---|---|
Total Population | 13,076 | 103,070 | 257,776 | |
Population Median Age | 39 | 38 | 38 | |
Population by Age | 0-9 Yrs | 1416 (10%) | 12662 (12%) | 30635 (11%) |
10-19 Yrs | 1379 (10%) | 11652 (11%) | 29926 (11%) | |
20-29 Yrs | 2450 (18%) | 17770 (17%) | 42530 (16%) | |
30-39 Yrs | 1407 (10%) | 14906 (14%) | 37448 (14%) | |
40-49 Yrs | 1732 (13%) | 12782 (12%) | 30801 (11%) | |
50-59 Yrs | 1927 (14%) | 13341 (12%) | 33934 (13%) | |
60-69 Yrs | 1526 (11%) | 10383 (10%) | 27175 (10%) | |
70+ Yrs | 1239 (9%) | 9573 (9%) | 25329 (9%) | |
Median HH Income | $66,039 | $70,815 | $73,773 | |
Total Household Income | < 24K | 609 (12%) | 4189 (10%) | 10616 (10%) |
25-49K | 1287 (25%) | 9333 (23%) | 20772 (20%) | |
50-74K | 964 (19%) | 7805 (19%) | 20090 (19%) | |
75-99K | 773 (15%) | 6731 (16%) | 15808 (15%) | |
100-199K | 1099 (22%) | 9617 (24%) | 26525 (26%) | |
200K+ | 260 (5%) | 2343 (5%) | 7177 (7%) | |
Highest Education Level | No Diploma | 1071 | 4961 | 11764 |
Diploma or GED | 2067 | 15915 | 37753 | |
Some College | 2480 | 19383 | 44619 | |
Assoc. Degree | 1164 | 7780 | 19281 | |
Bachelors Degree | 1657 | 14360 | 39299 | |
Higher Degree | 888 | 8950 | 25187 | |
Total Housing Units | 5,312 | 42,457 | 107,602 | |
--Owner-Occupied | 2,862 | 23,922 | 62,086 | |
--Renter-Occupied | 2,130 | 16,096 | 38,902 | |
Owner-Occupied Values | < 100K | 119 | 892 | 2280 |
100-199K | 679 | 5702 | 13524 | |
200-299K | 1082 | 8579 | 19988 | |
300-399K | 664 | 3648 | 11107 | |
400-499K | 97 | 1920 | 5516 | |
500K+ | 220 | 3181 | 9672 | |
Total Working Age Population | 10,915 | 83,419 | 208,395 | |
In Work Force | 7,564 | 59,555 | 146,827 | |
Not In Work Force | 3,351 | 23,865 | 61,568 | |
Workforce Employed | 6,874 | 52,445 | 128,811 | |
Workforce Unemployed | 366 | 2,929 | 6,067 | |
Civlian Workforce | 7,240 | 55,374 | 134,878 | |
Military Workforce | 324 | 4,181 | 11,949 | |
Total Households | 4,992 | 40,018 | 100,989 | |
Family Households | 3,429 | 26,929 | 67,149 | |
Non-Family Households | 1,563 | 13,089 | 33,840 | |
Married Couple | 2,521 | 19,113 | 48,642 | |
Other Family | 908 | 7,816 | 18,506 | |
Married w/Child | 927 | 7,737 | 18,624 | |
Single Male w/Child | 121 | 1,060 | 2,622 | |
Single Female w/Child | 275 | 2,837 | 7,221 |
Population Change Last Two Decades - Plus Projection
2000 | % | 2010 | % | 2020 | % | 2030 | |
---|---|---|---|---|---|---|---|
Virginia | 7,078,515 | +13 | 8,001,024 | +8 | 8,655,021 | +8 | 9,331,666 |
Virginia Beach city | 425,257 | +3 | 437,994 | +4 | 457,699 | +2 | 467,187 |
Total Working Age Population:
Total Households:
Total Working Age Population:
Total Households:
Total Working Age Population:
Total Households: