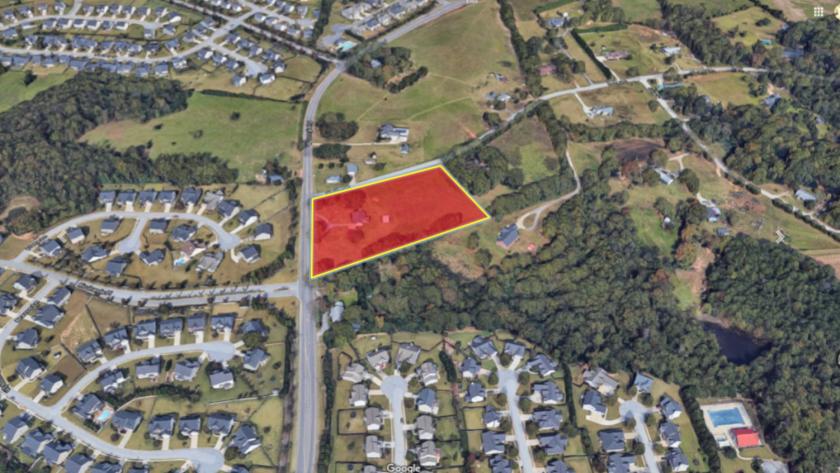
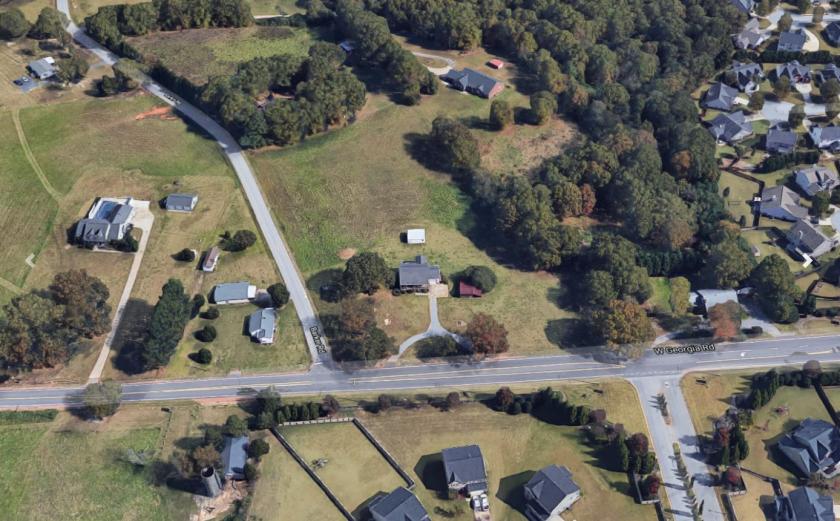
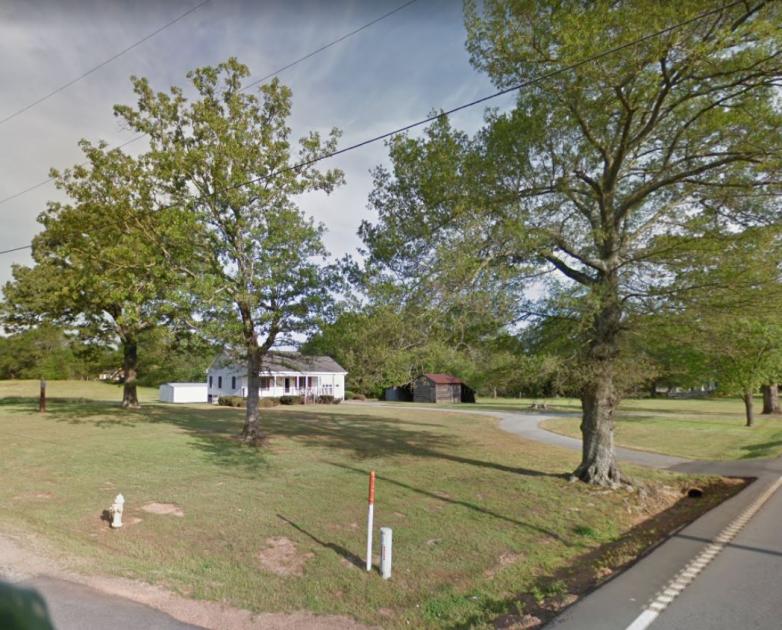
1-Mile | 3-Miles | 5-Miles | ||
---|---|---|---|---|
Total Population | 6,014 | 36,763 | 80,254 | |
Population Median Age | 37 | 38 | 38 | |
Population by Age | 0-9 Yrs | 719 (11%) | 4373 (11%) | 10017 (12%) |
10-19 Yrs | 1060 (17%) | 5479 (14%) | 11211 (13%) | |
20-29 Yrs | 592 (9%) | 4434 (12%) | 9129 (11%) | |
30-39 Yrs | 752 (12%) | 5092 (13%) | 11386 (14%) | |
40-49 Yrs | 1095 (18%) | 5621 (15%) | 11528 (14%) | |
50-59 Yrs | 880 (14%) | 4892 (13%) | 10859 (13%) | |
60-69 Yrs | 494 (8%) | 3767 (10%) | 8864 (11%) | |
70+ Yrs | 422 (7%) | 3105 (8%) | 7260 (9%) | |
Median HH Income | $99,943 | $74,241 | $71,054 | |
Total Household Income | < 24K | 109 (5%) | 1268 (9%) | 3282 (11%) |
25-49K | 281 (14%) | 3067 (22%) | 6631 (22%) | |
50-74K | 287 (14%) | 2411 (18%) | 5573 (19%) | |
75-99K | 291 (15%) | 2257 (16%) | 4786 (16%) | |
100-199K | 824 (42%) | 3718 (27%) | 7696 (26%) | |
200K+ | 144 (7%) | 638 (4%) | 1359 (4%) | |
Highest Education Level | No Diploma | 176 | 1454 | 4205 |
Diploma or GED | 720 | 6185 | 13714 | |
Some College | 809 | 5762 | 12460 | |
Assoc. Degree | 362 | 2804 | 5834 | |
Bachelors Degree | 1189 | 5484 | 11806 | |
Higher Degree | 622 | 3075 | 6554 | |
Total Housing Units | 1,983 | 13,978 | 31,144 | |
--Owner-Occupied | 1,759 | 10,912 | 23,260 | |
--Renter-Occupied | 177 | 2,446 | 6,067 | |
Owner-Occupied Values | < 100K | 43 | 1186 | 2676 |
100-199K | 367 | 5230 | 11492 | |
200-299K | 976 | 3329 | 6249 | |
300-399K | 306 | 781 | 1927 | |
400-499K | 43 | 244 | 560 | |
500K+ | 24 | 142 | 355 | |
Total Working Age Population | 4,570 | 28,582 | 62,661 | |
In Work Force | 3,065 | 20,059 | 42,666 | |
Not In Work Force | 1,505 | 8,523 | 19,995 | |
Workforce Employed | 3,012 | 19,552 | 41,222 | |
Workforce Unemployed | 53 | 507 | 1,437 | |
Civlian Workforce | 3,065 | 20,058 | 42,659 | |
Military Workforce | 0 | 1 | 7 | |
Total Households | 1,936 | 13,358 | 29,327 | |
Family Households | 1,650 | 9,925 | 21,474 | |
Non-Family Households | 286 | 3,433 | 7,853 | |
Married Couple | 1,440 | 7,718 | 16,303 | |
Other Family | 210 | 2,207 | 5,171 | |
Married w/Child | 696 | 3,123 | 6,584 | |
Single Male w/Child | 36 | 174 | 612 | |
Single Female w/Child | 79 | 1,151 | 2,240 |
Population Change Last Two Decades - Plus Projection
2000 | % | 2010 | % | 2020 | % | 2030 | |
---|---|---|---|---|---|---|---|
South Carolina | 4,012,012 | +15 | 4,625,364 | +9 | 5,020,400 | +9 | 5,488,460 |
Greenville County | 379,616 | +19 | 451,225 | +9 | 492,890 | +10 | 542,290 |
Total Working Age Population:
Total Households:
Total Working Age Population:
Total Households:
Total Working Age Population:
Total Households: