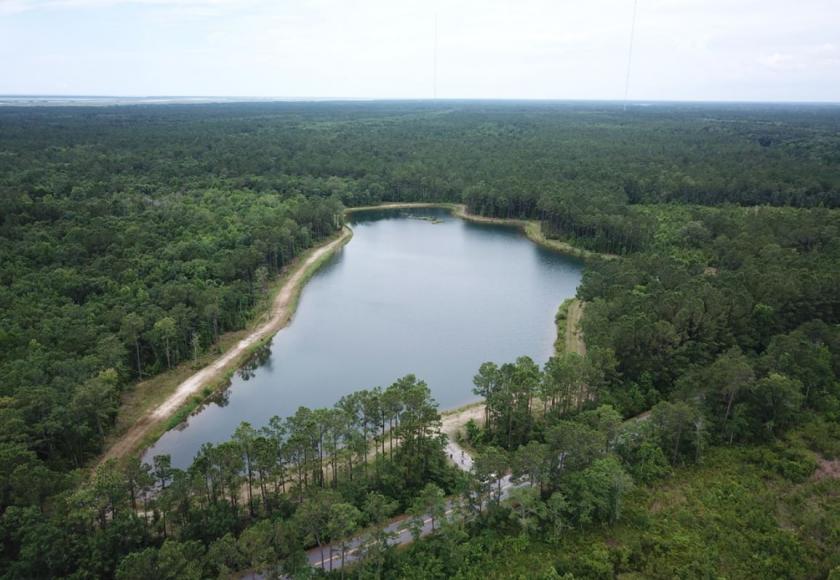
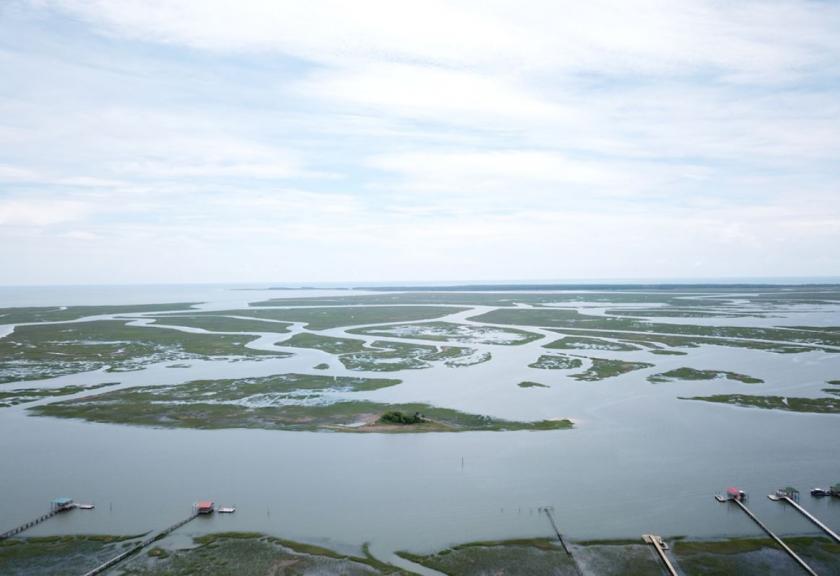
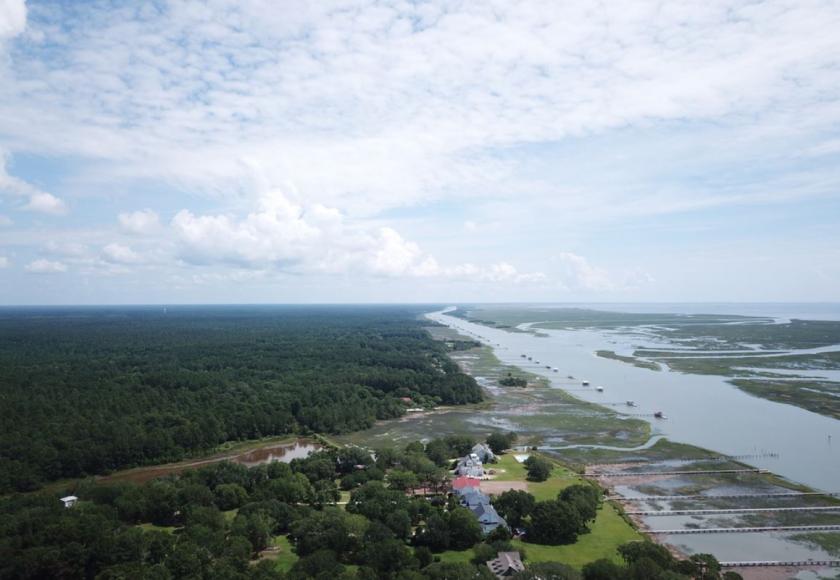
1-Mile | 3-Miles | 5-Miles | ||
---|---|---|---|---|
Total Population | 78 | 656 | 2,455 | |
Population Median Age | 47 | 46 | 44 | |
Population by Age | 0-9 Yrs | 6 (7%) | 57 (8%) | 259 (10%) |
10-19 Yrs | 7 (8%) | 59 (8%) | 218 (8%) | |
20-29 Yrs | 10 (12%) | 74 (11%) | 242 (9%) | |
30-39 Yrs | 9 (11%) | 68 (10%) | 248 (10%) | |
40-49 Yrs | 6 (7%) | 58 (8%) | 272 (11%) | |
50-59 Yrs | 14 (17%) | 123 (18%) | 548 (22%) | |
60-69 Yrs | 9 (11%) | 95 (14%) | 356 (14%) | |
70+ Yrs | 17 (21%) | 123 (18%) | 313 (12%) | |
Median HH Income | $58,672 | $61,281 | $72,406 | |
Total Household Income | < 24K | 5 (17%) | 39 (16%) | 122 (13%) |
25-49K | 6 (21%) | 50 (20%) | 129 (14%) | |
50-74K | 9 (32%) | 66 (27%) | 226 (24%) | |
75-99K | 5 (17%) | 41 (17%) | 110 (12%) | |
100-199K | 2 (7%) | 30 (12%) | 234 (25%) | |
200K+ | 1 (3%) | 14 (5%) | 84 (9%) | |
Highest Education Level | No Diploma | 8 | 58 | 143 |
Diploma or GED | 16 | 139 | 490 | |
Some College | 16 | 116 | 308 | |
Assoc. Degree | 4 | 44 | 234 | |
Bachelors Degree | 11 | 109 | 484 | |
Higher Degree | 3 | 27 | 158 | |
Total Housing Units | 31 | 265 | 973 | |
--Owner-Occupied | 24 | 213 | 832 | |
--Renter-Occupied | 3 | 28 | 72 | |
Owner-Occupied Values | < 100K | 4 | 37 | 96 |
100-199K | 5 | 42 | 159 | |
200-299K | 3 | 21 | 57 | |
300-399K | 2 | 18 | 115 | |
400-499K | 4 | 33 | 135 | |
500K+ | 7 | 62 | 271 | |
Total Working Age Population | 65 | 550 | 2,022 | |
In Work Force | 40 | 347 | 1,349 | |
Not In Work Force | 25 | 203 | 673 | |
Workforce Employed | 40 | 340 | 1,326 | |
Workforce Unemployed | 1 | 6 | 18 | |
Civlian Workforce | 40 | 347 | 1,343 | |
Military Workforce | 0 | 0 | 5 | |
Total Households | 28 | 241 | 905 | |
Family Households | 21 | 178 | 708 | |
Non-Family Households | 6 | 63 | 196 | |
Married Couple | 13 | 117 | 560 | |
Other Family | 9 | 61 | 148 | |
Married w/Child | 1 | 20 | 147 | |
Single Male w/Child | 0 | 1 | 3 | |
Single Female w/Child | 2 | 13 | 31 |
Population Change Last Two Decades - Plus Projection
2000 | % | 2010 | % | 2020 | % | 2030 | |
---|---|---|---|---|---|---|---|
South Carolina | 4,012,012 | +15 | 4,625,364 | +9 | 5,020,400 | +9 | 5,488,460 |
Charleston County | 309,969 | +13 | 350,209 | +5 | 366,380 | +6 | 386,660 |
Total Working Age Population:
Total Households:
Total Working Age Population:
Total Households:
Total Working Age Population:
Total Households: