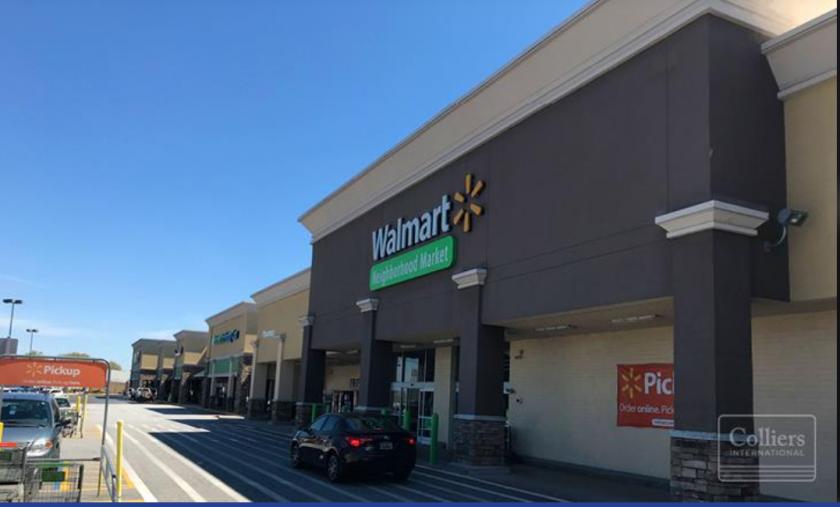
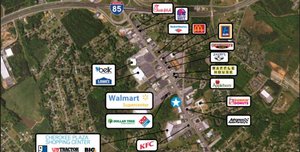
1-Mile | 3-Miles | 5-Miles | ||
---|---|---|---|---|
Total Population | 5,306 | 36,589 | 83,952 | |
Population Median Age | 37 | 39 | 39 | |
Population by Age | 0-9 Yrs | 787 (14%) | 4749 (12%) | 10696 (12%) |
10-19 Yrs | 670 (12%) | 4524 (12%) | 10503 (12%) | |
20-29 Yrs | 776 (14%) | 4897 (13%) | 10317 (12%) | |
30-39 Yrs | 685 (12%) | 4900 (13%) | 10958 (13%) | |
40-49 Yrs | 697 (13%) | 4842 (13%) | 11431 (13%) | |
50-59 Yrs | 589 (11%) | 4461 (12%) | 11133 (13%) | |
60-69 Yrs | 572 (10%) | 4363 (11%) | 10310 (12%) | |
70+ Yrs | 532 (10%) | 3854 (10%) | 8604 (10%) | |
Median HH Income | $48,151 | $54,423 | $62,202 | |
Total Household Income | < 24K | 570 (26%) | 3096 (21%) | 5537 (17%) |
25-49K | 536 (25%) | 3372 (23%) | 7031 (21%) | |
50-74K | 400 (18%) | 2702 (19%) | 6495 (20%) | |
75-99K | 275 (12%) | 2095 (14%) | 4672 (14%) | |
100-199K | 305 (14%) | 2328 (16%) | 6915 (21%) | |
200K+ | 50 (2%) | 480 (3%) | 1407 (4%) | |
Highest Education Level | No Diploma | 541 | 3743 | 6405 |
Diploma or GED | 975 | 6772 | 14526 | |
Some College | 673 | 5362 | 12512 | |
Assoc. Degree | 278 | 2393 | 6150 | |
Bachelors Degree | 688 | 4756 | 12617 | |
Higher Degree | 334 | 2197 | 6071 | |
Total Housing Units | 2,397 | 15,350 | 34,323 | |
--Owner-Occupied | 1,182 | 9,208 | 23,536 | |
--Renter-Occupied | 954 | 4,865 | 8,521 | |
Owner-Occupied Values | < 100K | 243 | 1949 | 3739 |
100-199K | 613 | 4473 | 10898 | |
200-299K | 245 | 2003 | 5085 | |
300-399K | 61 | 499 | 2279 | |
400-499K | 12 | 131 | 721 | |
500K+ | 9 | 154 | 814 | |
Total Working Age Population | 4,121 | 28,911 | 66,599 | |
In Work Force | 2,776 | 19,118 | 43,925 | |
Not In Work Force | 1,345 | 9,793 | 22,674 | |
Workforce Employed | 2,678 | 18,351 | 42,105 | |
Workforce Unemployed | 98 | 763 | 1,796 | |
Civlian Workforce | 2,776 | 19,114 | 43,901 | |
Military Workforce | 0 | 4 | 24 | |
Total Households | 2,136 | 14,073 | 32,057 | |
Family Households | 1,254 | 9,181 | 22,091 | |
Non-Family Households | 882 | 4,892 | 9,965 | |
Married Couple | 834 | 7,009 | 17,787 | |
Other Family | 420 | 2,172 | 4,304 | |
Married w/Child | 409 | 3,140 | 7,735 | |
Single Male w/Child | 20 | 212 | 561 | |
Single Female w/Child | 229 | 951 | 1,633 |
Population Change Last Two Decades - Plus Projection
2000 | % | 2010 | % | 2020 | % | 2030 | |
---|---|---|---|---|---|---|---|
South Carolina | 4,012,012 | +15 | 4,625,364 | +9 | 5,020,400 | +9 | 5,488,460 |
Greenville County | 379,616 | +19 | 451,225 | +9 | 492,890 | +10 | 542,290 |
Spartanburg County | 253,791 | +12 | 284,307 | +9 | 310,220 | +9 | 336,810 |
Total Working Age Population:
Total Households:
Total Working Age Population:
Total Households:
Total Working Age Population:
Total Households: