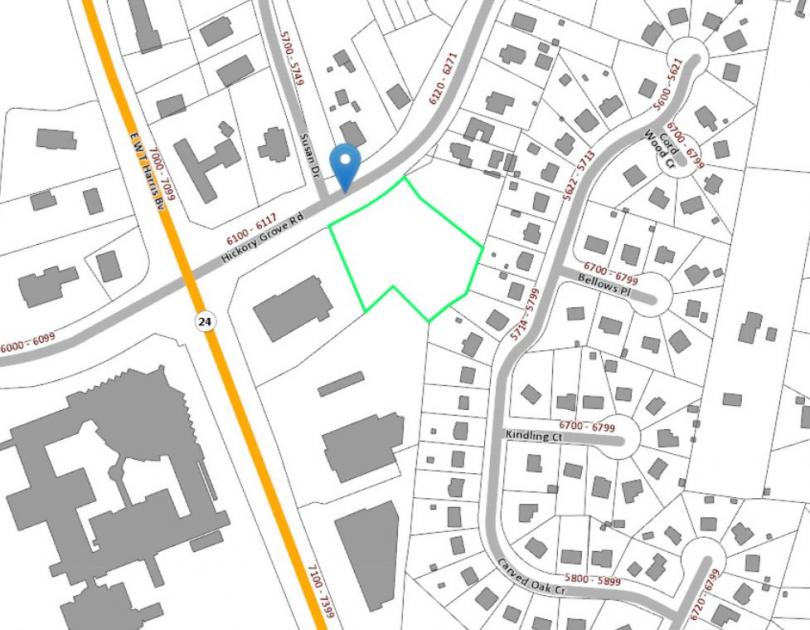
1-Mile | 3-Miles | 5-Miles | ||
---|---|---|---|---|
Total Population | 12,243 | 105,039 | 236,287 | |
Population Median Age | 32 | 34 | 35 | |
Population by Age | 0-9 Yrs | 2254 (18%) | 16625 (15%) | 35097 (14%) |
10-19 Yrs | 1754 (14%) | 14771 (14%) | 31556 (13%) | |
20-29 Yrs | 2096 (17%) | 17261 (16%) | 37392 (15%) | |
30-39 Yrs | 1907 (15%) | 16223 (15%) | 38109 (16%) | |
40-49 Yrs | 1473 (12%) | 13368 (12%) | 32154 (13%) | |
50-59 Yrs | 1291 (10%) | 11662 (11%) | 27326 (11%) | |
60-69 Yrs | 885 (7%) | 8295 (7%) | 19518 (8%) | |
70+ Yrs | 583 (4%) | 6834 (6%) | 15136 (6%) | |
Median HH Income | $48,867 | $44,415 | $49,253 | |
Total Household Income | < 24K | 749 (18%) | 8469 (23%) | 18479 (21%) |
25-49K | 1278 (32%) | 11181 (31%) | 25004 (29%) | |
50-74K | 921 (23%) | 7391 (20%) | 16431 (19%) | |
75-99K | 407 (10%) | 3996 (11%) | 9779 (11%) | |
100-199K | 462 (11%) | 3845 (10%) | 13223 (15%) | |
200K+ | 139 (3%) | 568 (1%) | 2976 (3%) | |
Highest Education Level | No Diploma | 1711 | 14903 | 26870 |
Diploma or GED | 2108 | 17707 | 35550 | |
Some College | 1514 | 14839 | 33849 | |
Assoc. Degree | 503 | 5030 | 12186 | |
Bachelors Degree | 1131 | 10042 | 31425 | |
Higher Degree | 374 | 3568 | 13637 | |
Total Housing Units | 4,456 | 38,454 | 92,495 | |
--Owner-Occupied | 1,831 | 16,370 | 42,793 | |
--Renter-Occupied | 2,125 | 19,081 | 43,100 | |
Owner-Occupied Values | < 100K | 328 | 3299 | 6274 |
100-199K | 1231 | 10285 | 21173 | |
200-299K | 197 | 2053 | 8751 | |
300-399K | 56 | 448 | 3263 | |
400-499K | 11 | 126 | 1531 | |
500K+ | 8 | 159 | 1801 | |
Total Working Age Population | 9,028 | 79,786 | 182,527 | |
In Work Force | 6,693 | 56,282 | 128,976 | |
Not In Work Force | 2,335 | 23,504 | 53,551 | |
Workforce Employed | 6,040 | 52,165 | 121,069 | |
Workforce Unemployed | 652 | 4,060 | 7,824 | |
Civlian Workforce | 6,693 | 56,225 | 128,893 | |
Military Workforce | 0 | 56 | 83 | |
Total Households | 3,956 | 35,450 | 85,893 | |
Family Households | 2,681 | 22,441 | 52,380 | |
Non-Family Households | 1,275 | 13,010 | 33,513 | |
Married Couple | 1,491 | 12,327 | 31,645 | |
Other Family | 1,190 | 10,114 | 20,735 | |
Married w/Child | 735 | 5,581 | 13,610 | |
Single Male w/Child | 158 | 1,309 | 3,004 | |
Single Female w/Child | 561 | 4,568 | 9,026 |
Population Change Last Two Decades - Plus Projection
2000 | % | 2010 | % | 2020 | % | 2030 | |
---|---|---|---|---|---|---|---|
North Carolina | 8,049,313 | +18 | 9,535,483 | +11 | 10,630,691 | +11 | 11,836,070 |
Cabarrus County | 131,063 | +36 | 178,011 | +22 | 216,608 | +20 | 259,075 |
Mecklenburg County | 695,454 | +32 | 919,628 | +23 | 1,131,342 | +19 | 1,348,822 |
Total Working Age Population:
Total Households:
Total Working Age Population:
Total Households:
Total Working Age Population:
Total Households: