Location
Located on the southeast corner of Stark Street and SE 122nd Avenue, the property benefit from quick access to public transit ( bus numbers 20 and 73) along with MAX access 5 blocks to the north on SE Burnside Street. Numerous restaurants nearby, along with shopping at Mall 205 and Gateway Shopping Center.
Description
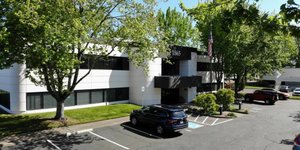
Former Fabric Depot retail space with a large open floor plan which can be used for retail, office, or commercial space. Loading doors on the north and east sides of the building. Large covered and fenced area could be used for excess parking, outdoor seating or excess storage. Additional 2nd floor office space of approximately 1,500 SF with restrooms. Abundant parking to accommodate a variety of uses.
Highlights
115 parking stalls plus covered parking
2 loading doors
Interior column spacing is 20' x 40'
Over 6,000 amps of power
Fully sprinklered
HVAC throughout the space
38,504 ADT at the corner of SE Stark Street. & SE 122nd Avenue (2018)
No part of this information may be copied, reproduced, repurposed, or screen-captured for any commercial purpose without prior written authorization from MyEListing.
While we strive to provide the most accurate information, all listing information, and demographic data, is provided by third-parties. As such, MyEListing will not be responsible for the accuracy of the information. It is strongly recommended that you verify all information with the listing agent, and any relevant agencies, prior to making any decisions.
What is the asking price for 700 Southeast 122nd Avenue in Portland?
The asking price for 700 Southeast 122nd Avenue is $12.00 a SF per Year
What is the building size of this commercial Retail property?
The size of this lease property at '.700 Southeast 122nd Avenue.' is 77211 square feet
What kind of Retail is the propery at 700 Southeast 122nd Avenue?
The property at 700 Southeast 122nd Avenue Portland, OR 97233 is listed as a Other Retail Retail property
What is the population within 1 mile of 700 Southeast 122nd Avenue in Portland?
The population within 1 mile of 700 Southeast 122nd Avenue Portland, OR 97233 is 24,674 people.
Who do I contact for questions about 700 Southeast 122nd Avenue?
You should contact the listing agent,
Joe Kappler, for any details regarding this commercial listing.