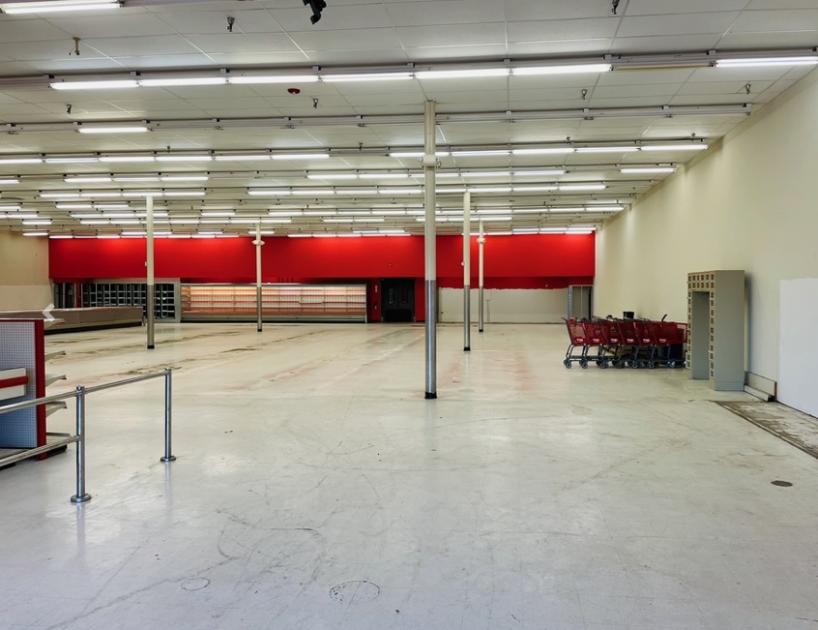
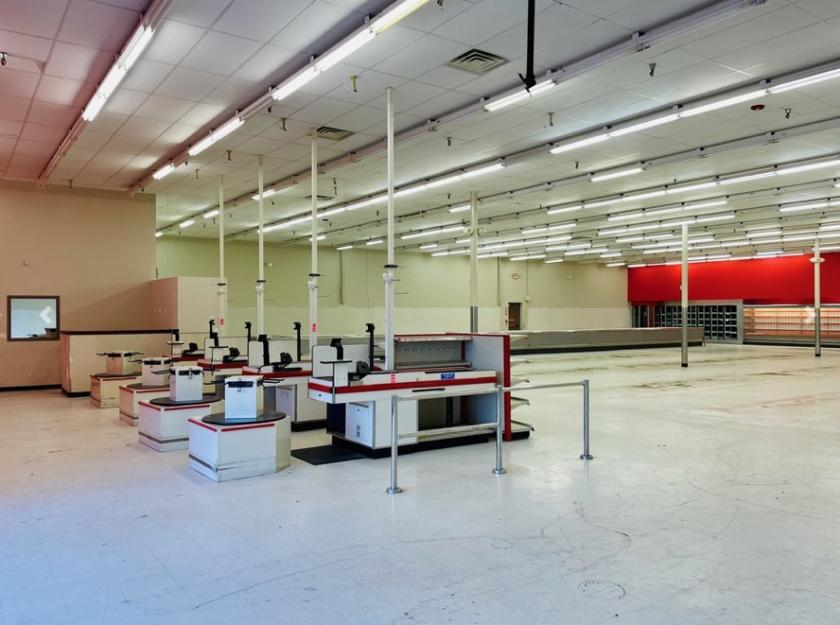
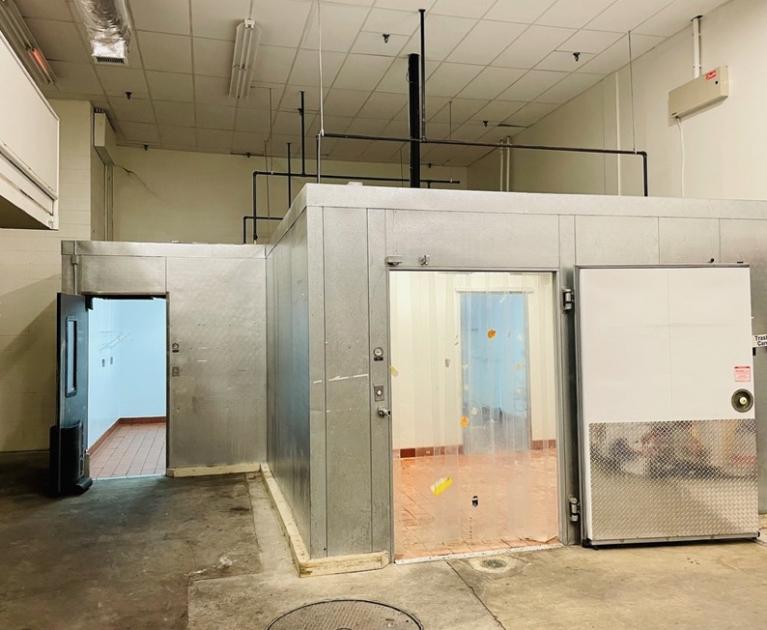
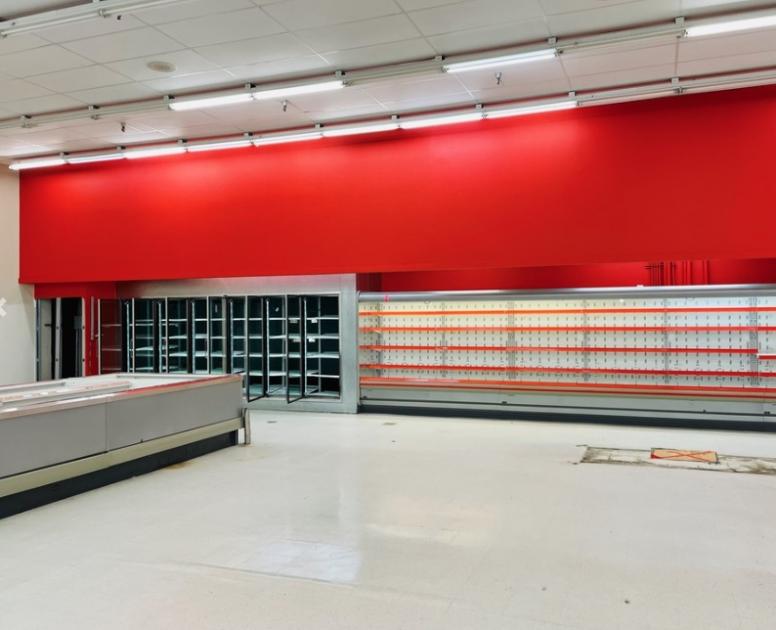
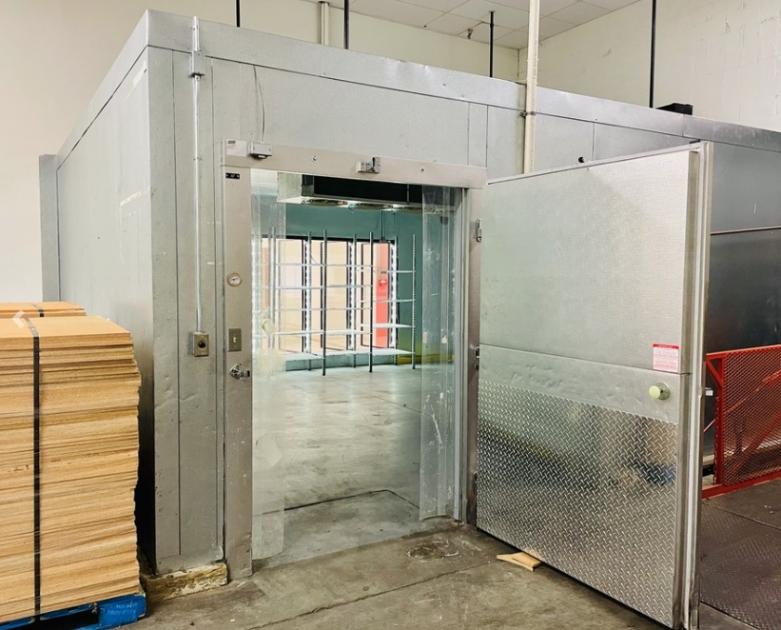
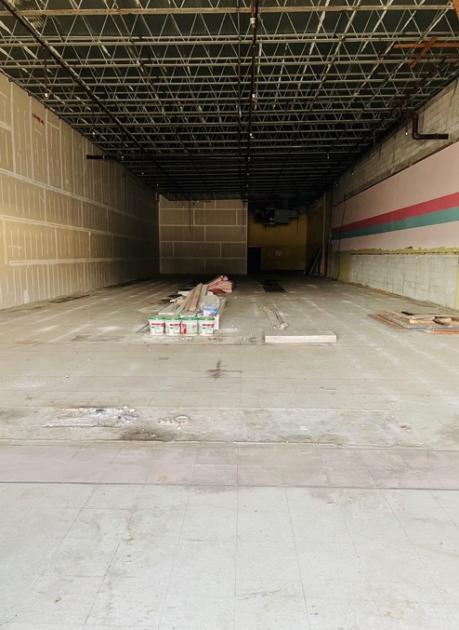
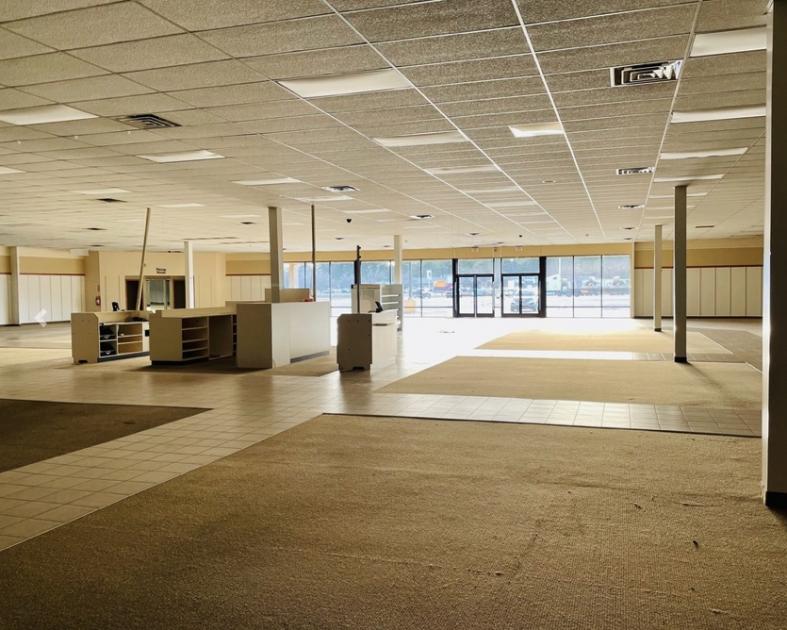
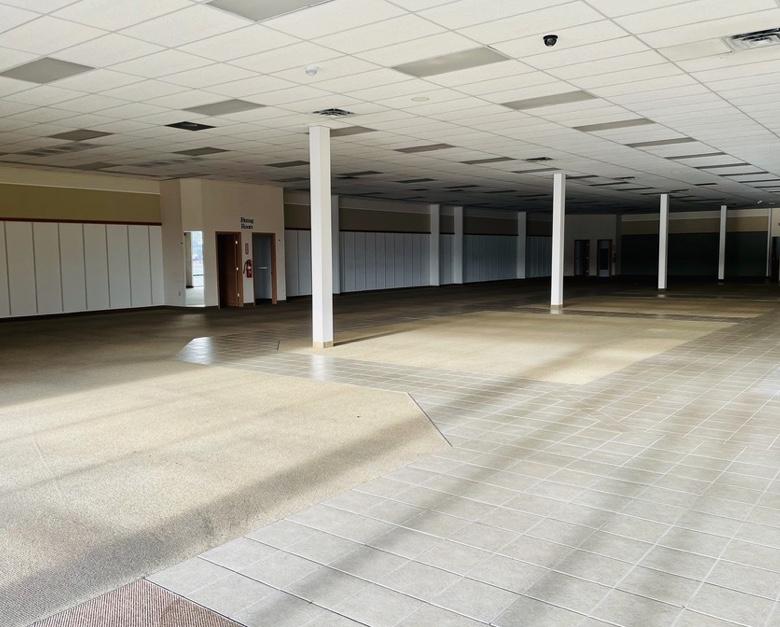
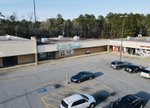
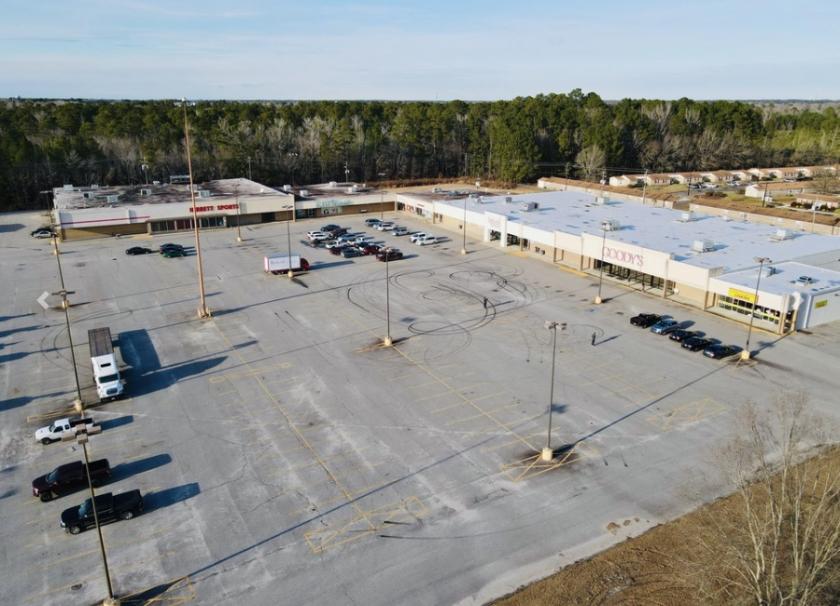
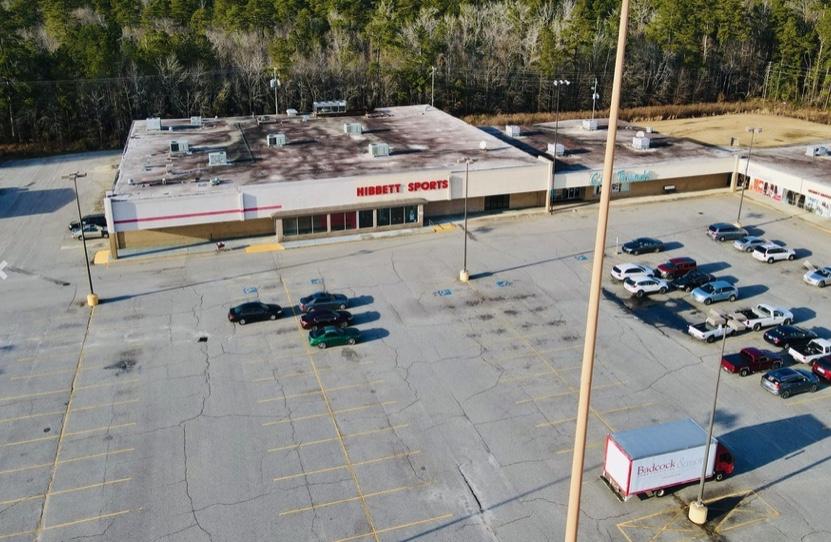
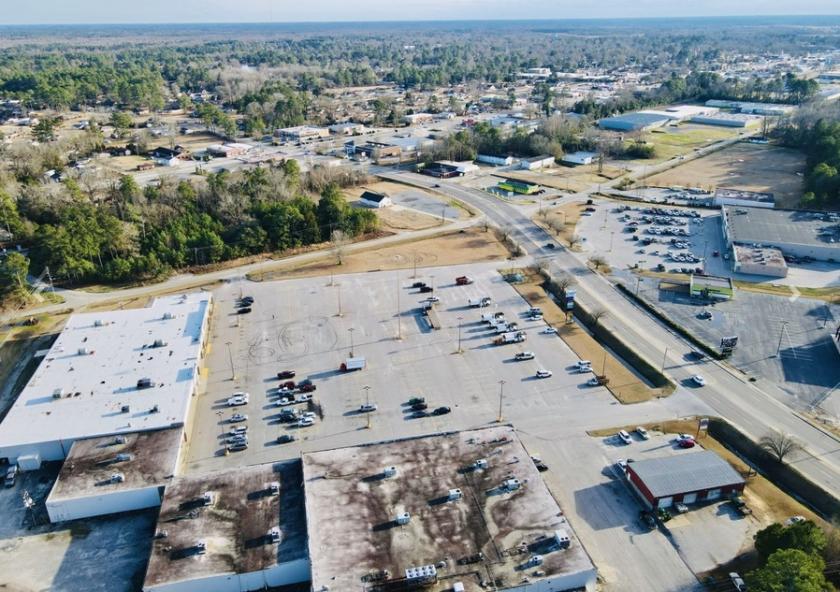
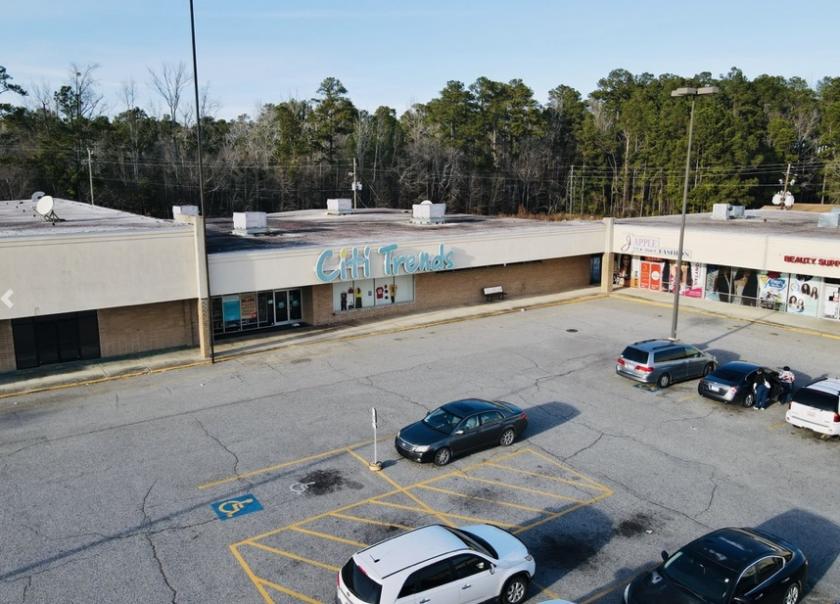
Retail Space
204 Radford Boulevard Dillon, SC 29536
204 Radford Boulevard Dillon, SC 29536
Details & Description
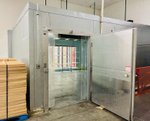
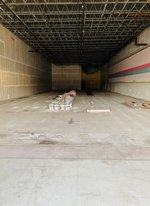
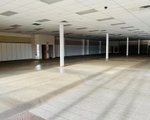
Additional Photos

Listing Agents

Dustin Tenney
O: 864-637-9302
M: 864-757-4761
dustin.tenney@svn.com
O: 864-637-9302
M: 864-757-4761
dustin.tenney@svn.com
While we strive to provide the most accurate information, all listing information, and demographic data, is provided by third-parties. As such, MyEListing will not be responsible for the accuracy of the information. It is strongly recommended that you verify all information with the listing agent, and any relevant agencies, prior to making any decisions.