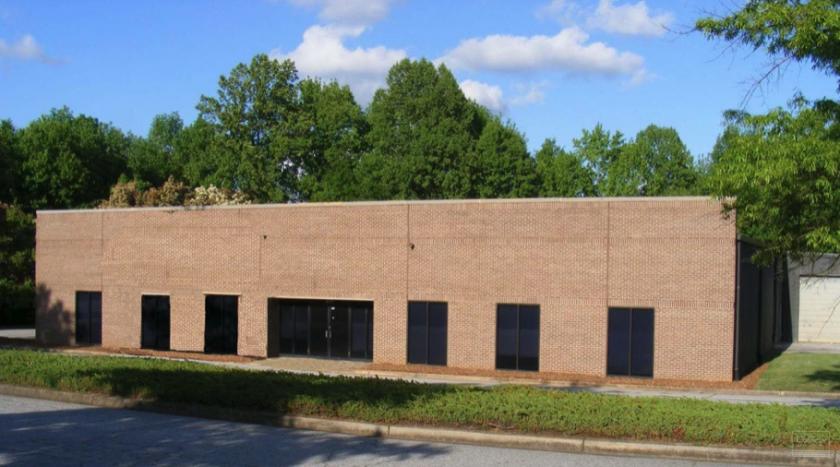
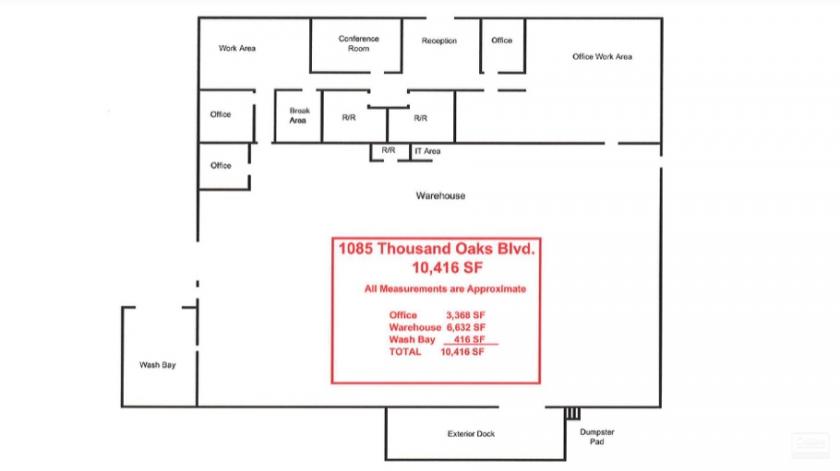
1085 Thousand Oaks Blvd is located in the Golden Oaks Business Park off of Woodruff Road in Greenville, SC with easy access to I-85 and I-385. The building offers a total ±10,416 SF for lease with ±3,368 SF of office space, ±6,632 SF of warehouse space and a ±416 SF wash bay. The space provides flexibility in which the office area can be modified for tenant needs. The warehouse offers a side entrance drive and expanded rear dock.
Features:
Flexible office space adaptable for different uses
Dedicated dock high door (10’ X 12’) with staging area
Ground level drive-in door
Corner lot increases parking availability
Zoned I-1
Easy access to I-85 and I-385
Office area can be modified for tenant needs
No part of this information may be copied, reproduced, repurposed, or screen-captured for any commercial purpose without prior written authorization from MyEListing.
While we strive to provide the most accurate information, all listing information, and demographic data, is provided by third-parties. As such, MyEListing will not be responsible for the accuracy of the information. It is strongly recommended that you verify all information with the listing agent, and any relevant agencies, prior to making any decisions.
What is the asking price for 1085 Thousand Oaks Boulevard in Greenville?
The asking price for 1085 Thousand Oaks Boulevard is $7.35 a SF per Year
What is the building size of this commercial Industrial property?
The size of this lease property at '.1085 Thousand Oaks Boulevard.' is 10416 square feet
What kind of Industrial is the propery at 1085 Thousand Oaks Boulevard?
The property at 1085 Thousand Oaks Boulevard Greenville, SC 29607 is listed as a Flex-Office-Warehouse Industrial property
What is the population within 1 mile of 1085 Thousand Oaks Boulevard in Greenville?
The population within 1 mile of 1085 Thousand Oaks Boulevard Greenville, SC 29607 is 5,574 people.
Who do I contact for questions about 1085 Thousand Oaks Boulevard?
You should contact the listing agent,
Richard Barrett, for any details regarding this commercial listing.