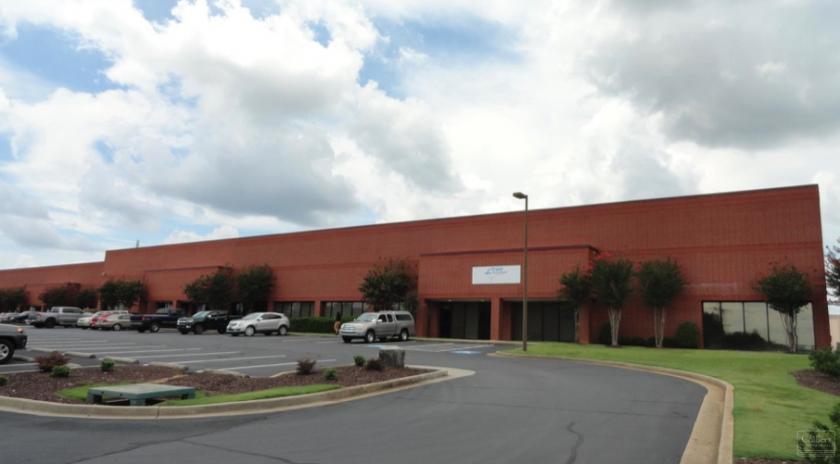
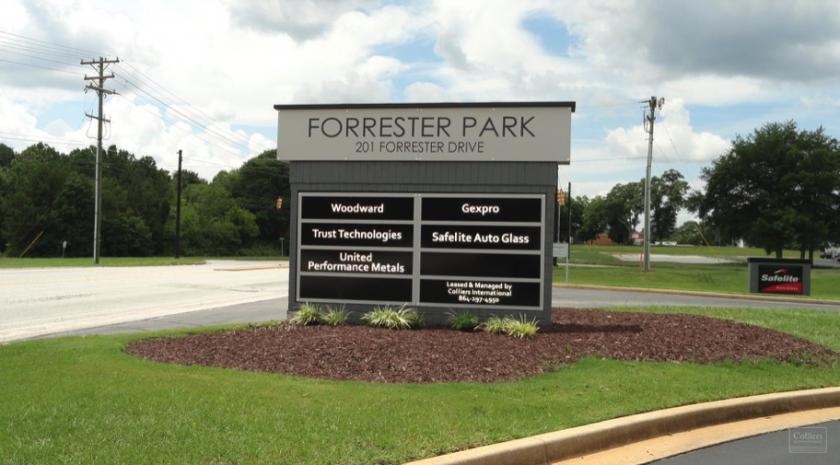
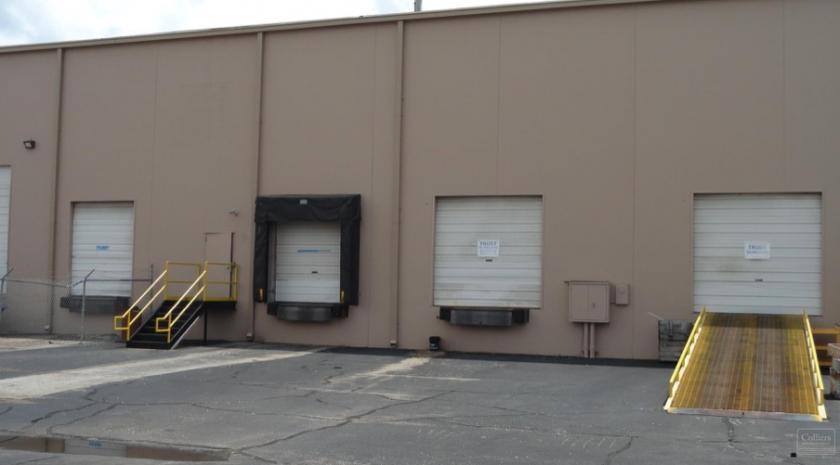
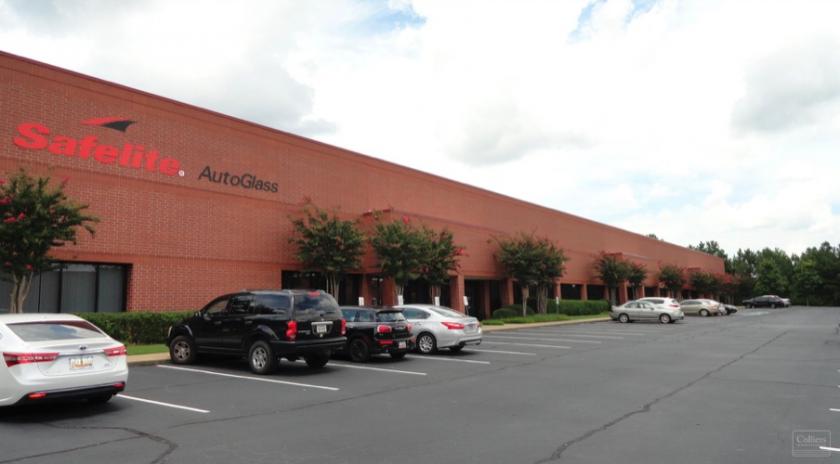
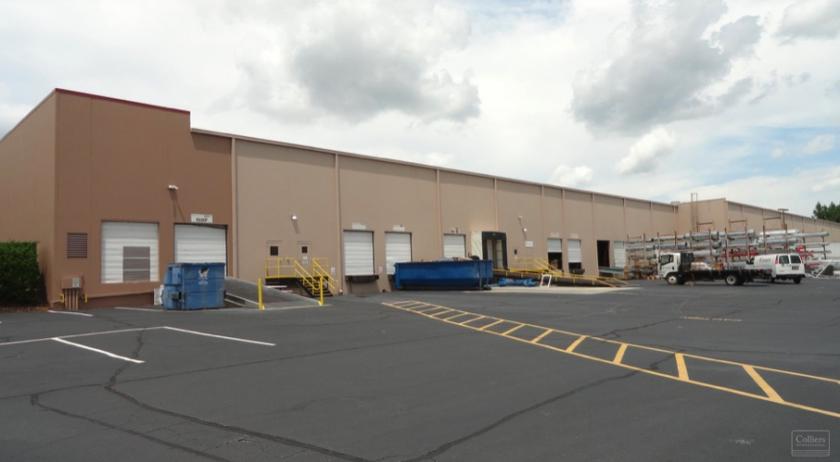
Forrester Park is comprised of ±236,800 SF of business distribution and light manufacturing space. The three multi-tenant buildings are constructed of brick and pre-cast concrete panels. Building features include 24' ceiling heights, ample parking, loading docks, drive in doors and signage above tenant spaces as well as on park monument. Forrester Park is located next to ICAR and minutes from businesses including Hubbell Lighting, TD Bank and BMW.
Features:
Ideally located along Hwy 276
Easy interstate access to I-85 and I-385
Many local amenities are nearby, including: restaurants, banks, hotels and more
Zoned: I-1
Dedicated truck court with rear service loading docks
Situated on 17.5 acres
Flexible layouts for office and warehouse
Contact brokers for lease information
No part of this information may be copied, reproduced, repurposed, or screen-captured for any commercial purpose without prior written authorization from MyEListing.
While we strive to provide the most accurate information, all listing information, and demographic data, is provided by third-parties. As such, MyEListing will not be responsible for the accuracy of the information. It is strongly recommended that you verify all information with the listing agent, and any relevant agencies, prior to making any decisions.
What is the building size of this commercial Industrial property?
The size of this lease property at '.201 Forrester Drive.' is 22534 square feet
What kind of Industrial is the propery at 201 Forrester Drive?
The property at 201 Forrester Drive Greenville, SC 29607 is listed as a Distribution Industrial property
What is the population within 1 mile of 201 Forrester Drive in Greenville?
The population within 1 mile of 201 Forrester Drive Greenville, SC 29607 is 5,455 people.
Who do I contact for questions about 201 Forrester Drive?
You should contact the listing agent,
Richard Barrett, for any details regarding this commercial listing.