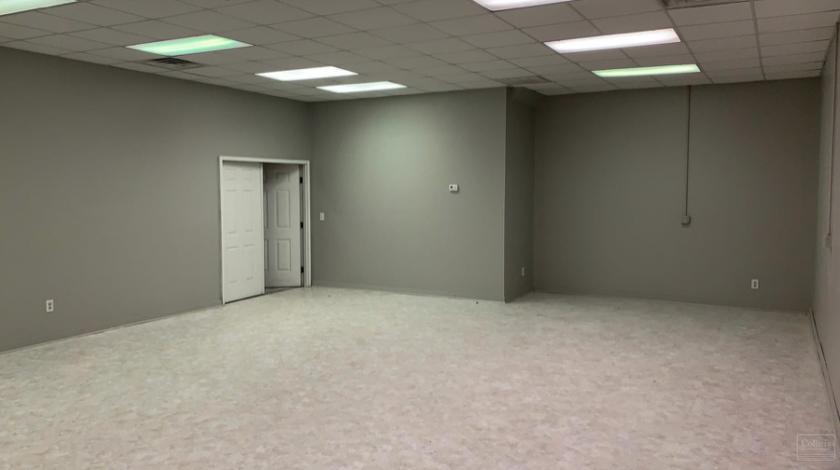
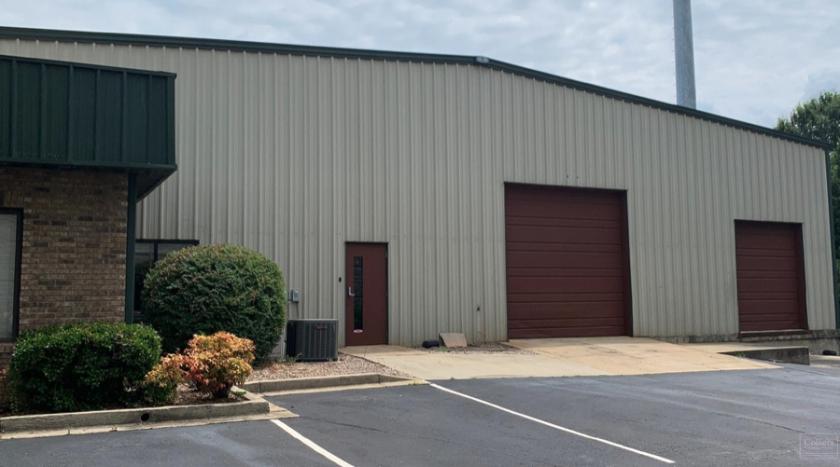
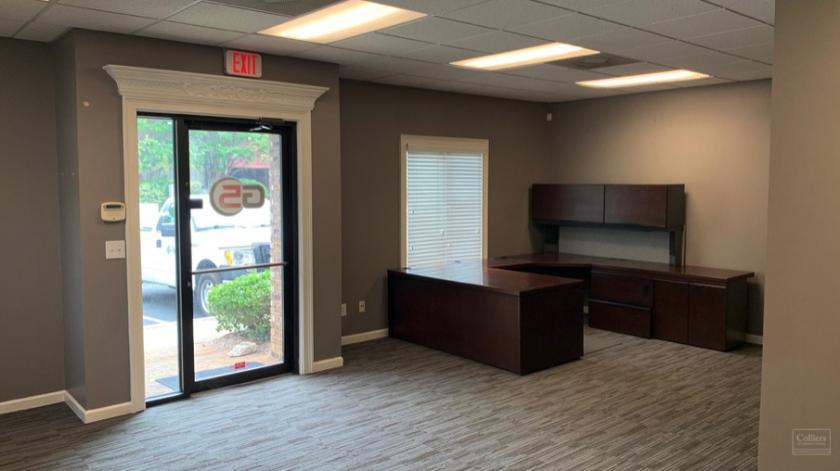
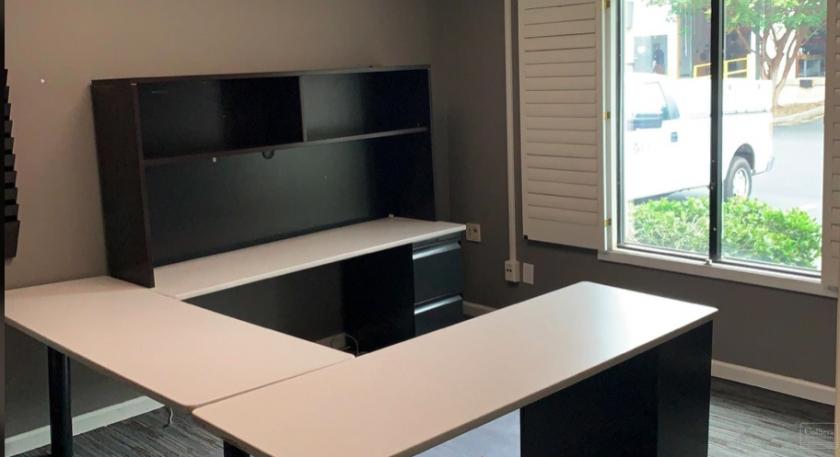
1-Mile | 3-Miles | 5-Miles | ||
---|---|---|---|---|
Total Population | 4,457 | 48,191 | 145,572 | |
Population Median Age | 40 | 40 | 39 | |
Population by Age | 0-9 Yrs | 545 (12%) | 5847 (12%) | 16786 (11%) |
10-19 Yrs | 402 (9%) | 5462 (11%) | 18963 (13%) | |
20-29 Yrs | 714 (16%) | 6780 (14%) | 20361 (13%) | |
30-39 Yrs | 684 (15%) | 6545 (13%) | 18823 (12%) | |
40-49 Yrs | 451 (10%) | 5948 (12%) | 19555 (13%) | |
50-59 Yrs | 594 (13%) | 6241 (12%) | 19127 (13%) | |
60-69 Yrs | 502 (11%) | 5067 (10%) | 16007 (10%) | |
70+ Yrs | 565 (12%) | 6301 (13%) | 15950 (10%) | |
Median HH Income | $70,556 | $73,941 | $70,990 | |
Total Household Income | < 24K | 354 (17%) | 3172 (15%) | 8774 (14%) |
25-49K | 371 (18%) | 3951 (19%) | 11866 (20%) | |
50-74K | 350 (17%) | 3331 (16%) | 10619 (17%) | |
75-99K | 358 (17%) | 3509 (17%) | 8616 (14%) | |
100-199K | 449 (22%) | 4820 (23%) | 13908 (23%) | |
200K+ | 151 (7%) | 1851 (8%) | 5427 (9%) | |
Highest Education Level | No Diploma | 152 | 1471 | 5616 |
Diploma or GED | 575 | 5629 | 17053 | |
Some College | 765 | 6573 | 19324 | |
Assoc. Degree | 220 | 2832 | 9570 | |
Bachelors Degree | 909 | 10791 | 30698 | |
Higher Degree | 617 | 6669 | 18274 | |
Total Housing Units | 2,196 | 22,601 | 63,740 | |
--Owner-Occupied | 1,061 | 11,709 | 37,148 | |
--Renter-Occupied | 972 | 8,925 | 22,064 | |
Owner-Occupied Values | < 100K | 60 | 744 | 2827 |
100-199K | 298 | 3614 | 12686 | |
200-299K | 342 | 3494 | 9397 | |
300-399K | 232 | 1888 | 5862 | |
400-499K | 40 | 894 | 2612 | |
500K+ | 89 | 1075 | 3765 | |
Total Working Age Population | 3,657 | 39,050 | 117,457 | |
In Work Force | 2,386 | 25,855 | 79,442 | |
Not In Work Force | 1,271 | 13,195 | 38,015 | |
Workforce Employed | 2,315 | 24,966 | 76,171 | |
Workforce Unemployed | 58 | 803 | 3,117 | |
Civlian Workforce | 2,373 | 25,769 | 79,288 | |
Military Workforce | 13 | 86 | 154 | |
Total Households | 2,033 | 20,634 | 59,212 | |
Family Households | 1,095 | 12,198 | 37,154 | |
Non-Family Households | 938 | 8,436 | 22,057 | |
Married Couple | 884 | 9,961 | 29,502 | |
Other Family | 211 | 2,237 | 7,652 | |
Married w/Child | 307 | 3,959 | 12,163 | |
Single Male w/Child | 41 | 263 | 1,057 | |
Single Female w/Child | 81 | 876 | 2,894 |
Population Change Last Two Decades - Plus Projection
2000 | % | 2010 | % | 2020 | % | 2030 | |
---|---|---|---|---|---|---|---|
South Carolina | 4,012,012 | +15 | 4,625,364 | +9 | 5,020,400 | +9 | 5,488,460 |
Greenville County | 379,616 | +19 | 451,225 | +9 | 492,890 | +10 | 542,290 |
Spartanburg County | 253,791 | +12 | 284,307 | +9 | 310,220 | +9 | 336,810 |
Total Working Age Population:
Total Households:
Total Working Age Population:
Total Households:
Total Working Age Population:
Total Households: