Industrial Properties
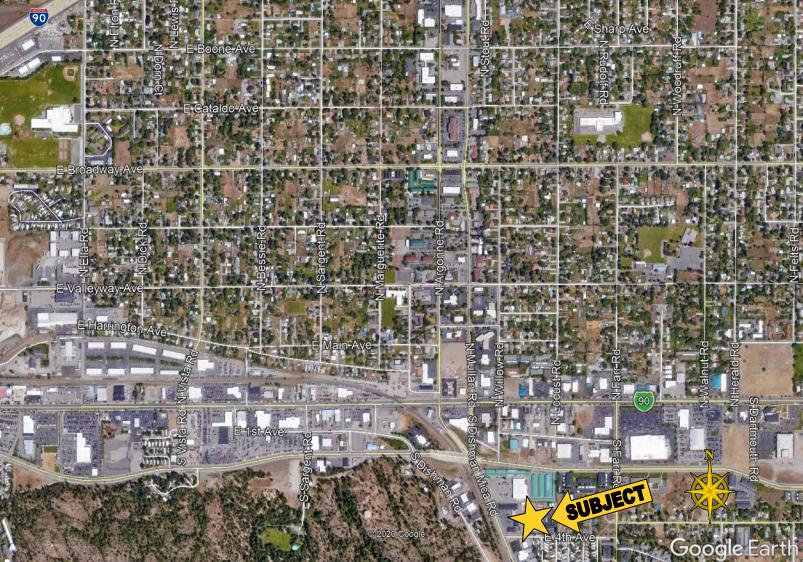
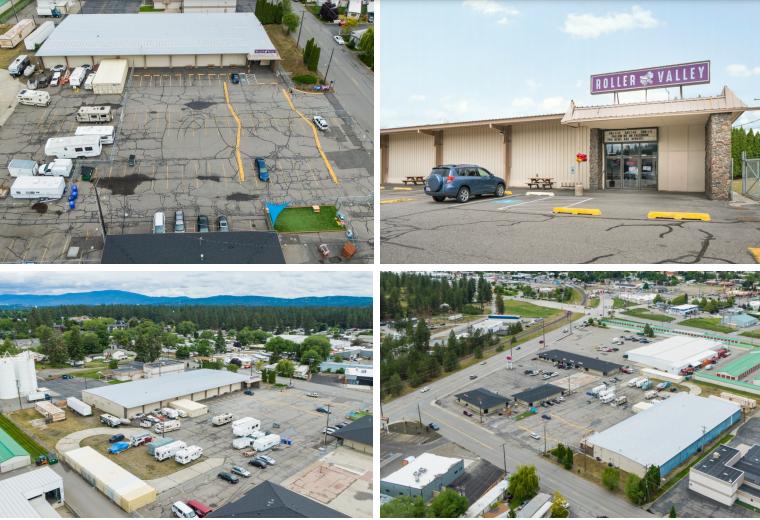
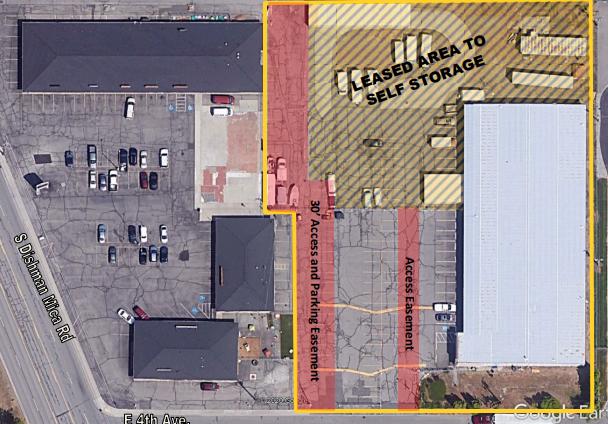
9415 East 4th Avenue Spokane Valley, WA 99206
9415 East 4th Avenue Spokane Valley, WA 99206
Details & Description
Listing Agents

Kevin Edwards
O: 509-838-8500
M: 509-939-8828
k.edwards@me.com
O: 509-838-8500
M: 509-939-8828
k.edwards@me.com
While we strive to provide the most accurate information, all listing information, and demographic data, is provided by third-parties. As such, MyEListing will not be responsible for the accuracy of the information. It is strongly recommended that you verify all information with the listing agent, and any relevant agencies, prior to making any decisions.