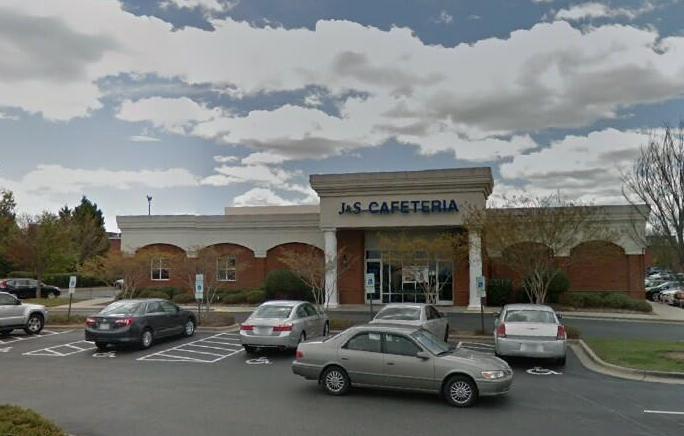
1-Mile | 3-Miles | 5-Miles | ||
---|---|---|---|---|
Total Population | 5,298 | 43,248 | 116,555 | |
Population Median Age | 38 | 39 | 38 | |
Population by Age | 0-9 Yrs | 563 (10%) | 4551 (10%) | 13675 (11%) |
10-19 Yrs | 721 (13%) | 5760 (13%) | 15859 (13%) | |
20-29 Yrs | 750 (14%) | 5531 (12%) | 17746 (15%) | |
30-39 Yrs | 737 (13%) | 5919 (13%) | 15545 (13%) | |
40-49 Yrs | 812 (15%) | 6297 (14%) | 15250 (13%) | |
50-59 Yrs | 745 (14%) | 5739 (13%) | 14467 (12%) | |
60-69 Yrs | 509 (9%) | 5084 (11%) | 12456 (10%) | |
70+ Yrs | 461 (8%) | 4366 (10%) | 11558 (9%) | |
Median HH Income | $69,374 | $71,997 | $57,369 | |
Total Household Income | < 24K | 226 (10%) | 1868 (10%) | 8088 (17%) |
25-49K | 489 (23%) | 3740 (21%) | 12279 (26%) | |
50-74K | 450 (21%) | 3474 (20%) | 8690 (18%) | |
75-99K | 325 (15%) | 2586 (14%) | 6306 (13%) | |
100-199K | 531 (25%) | 4522 (26%) | 8833 (19%) | |
200K+ | 100 (4%) | 1125 (6%) | 2066 (4%) | |
Highest Education Level | No Diploma | 225 | 1674 | 6367 |
Diploma or GED | 645 | 5080 | 17148 | |
Some College | 760 | 6000 | 17105 | |
Assoc. Degree | 322 | 2785 | 6818 | |
Bachelors Degree | 1103 | 9612 | 20282 | |
Higher Degree | 671 | 5582 | 11029 | |
Total Housing Units | 2,337 | 18,662 | 50,636 | |
--Owner-Occupied | 1,285 | 11,580 | 26,957 | |
--Renter-Occupied | 837 | 5,735 | 19,306 | |
Owner-Occupied Values | < 100K | 113 | 1045 | 4791 |
100-199K | 689 | 4617 | 12375 | |
200-299K | 383 | 4132 | 6563 | |
300-399K | 77 | 1386 | 2170 | |
400-499K | 14 | 250 | 488 | |
500K+ | 9 | 151 | 569 | |
Total Working Age Population | 4,266 | 35,229 | 94,359 | |
In Work Force | 2,987 | 23,934 | 62,155 | |
Not In Work Force | 1,278 | 11,295 | 32,204 | |
Workforce Employed | 2,866 | 22,945 | 58,898 | |
Workforce Unemployed | 115 | 924 | 3,162 | |
Civlian Workforce | 2,981 | 23,869 | 62,060 | |
Military Workforce | 6 | 65 | 96 | |
Total Households | 2,122 | 17,316 | 46,263 | |
Family Households | 1,388 | 11,572 | 29,658 | |
Non-Family Households | 734 | 5,743 | 16,605 | |
Married Couple | 1,065 | 8,933 | 20,889 | |
Other Family | 323 | 2,639 | 8,769 | |
Married w/Child | 438 | 3,470 | 8,111 | |
Single Male w/Child | 17 | 181 | 844 | |
Single Female w/Child | 141 | 1,220 | 4,101 |
Population Change Last Two Decades - Plus Projection
2000 | % | 2010 | % | 2020 | % | 2030 | |
---|---|---|---|---|---|---|---|
North Carolina | 8,049,313 | +18 | 9,535,483 | +11 | 10,630,691 | +11 | 11,836,070 |
Davidson County | 147,246 | +11 | 162,878 | +5 | 170,888 | +8 | 184,987 |
Forsyth County | 306,067 | +15 | 350,670 | +9 | 383,123 | +9 | 418,257 |
Guilford County | 421,048 | +16 | 488,406 | +12 | 545,348 | +13 | 615,227 |
Total Working Age Population:
Total Households:
Total Working Age Population:
Total Households:
Total Working Age Population:
Total Households: