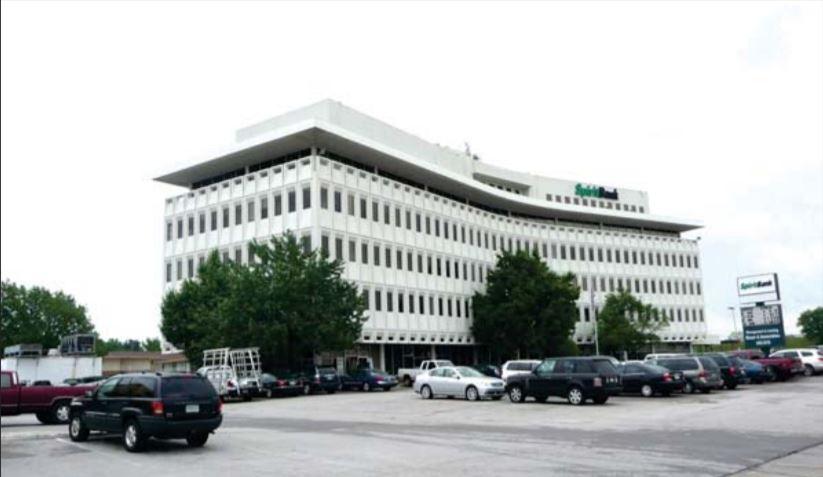
Office Space
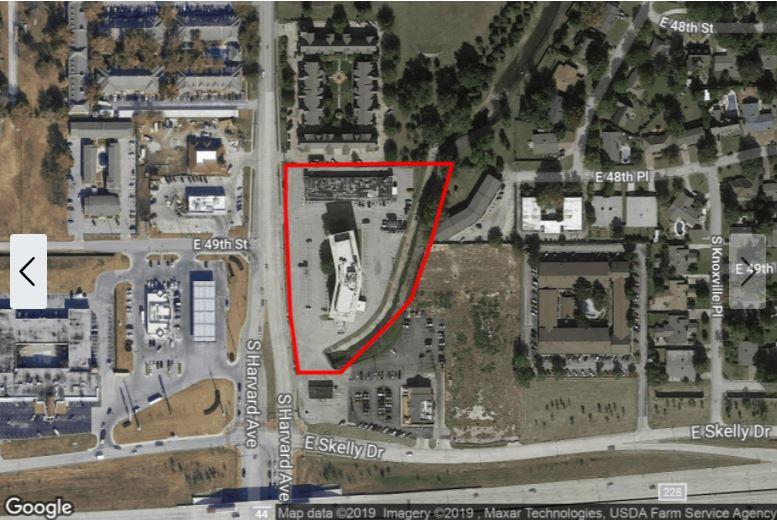
4815 South Harvard Avenue Tulsa, OK 74135
4815 South Harvard Avenue Tulsa, OK 74135
Details & Description
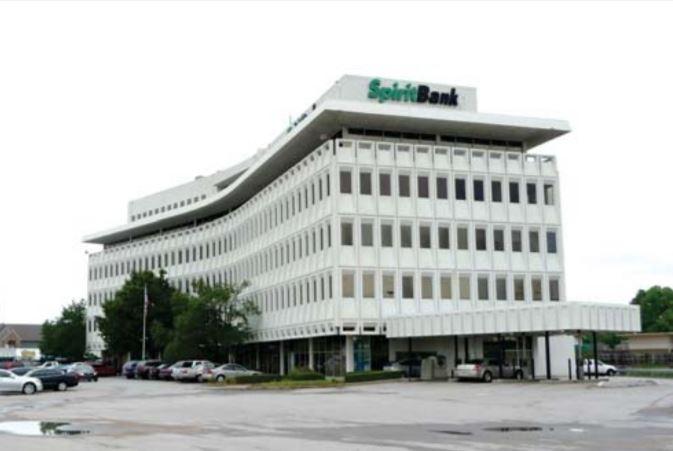
Additional Photos

Listing Agents

Douglas Bauer
O: 918-665-1210
dbauer@bauertulsa.com
O: 918-665-1210
dbauer@bauertulsa.com
While we strive to provide the most accurate information, all listing information, and demographic data, is provided by third-parties. As such, MyEListing will not be responsible for the accuracy of the information. It is strongly recommended that you verify all information with the listing agent, and any relevant agencies, prior to making any decisions.


