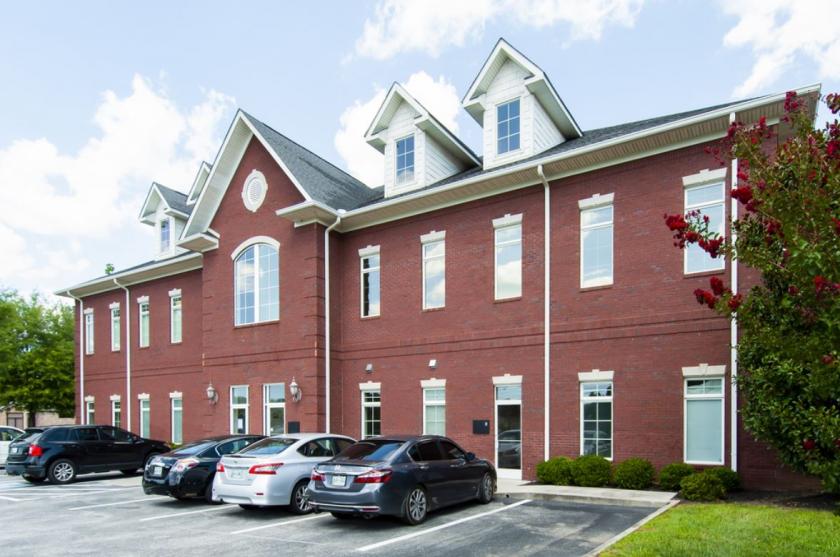
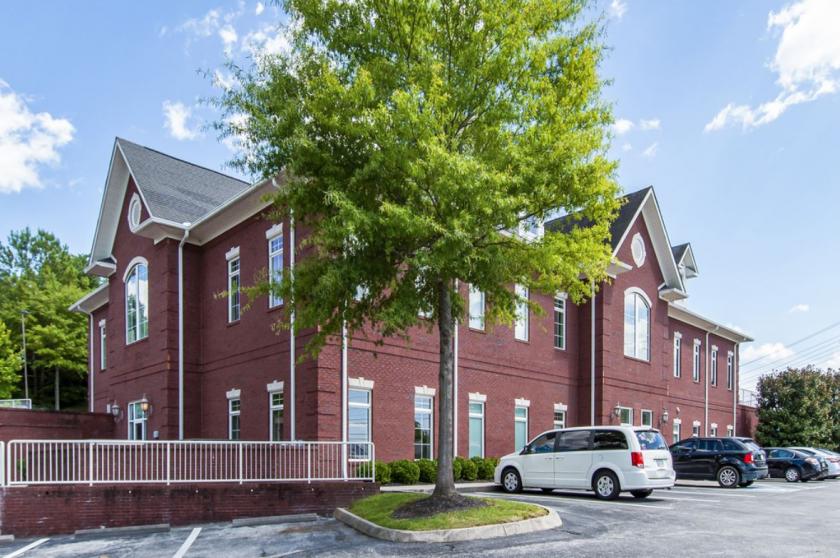
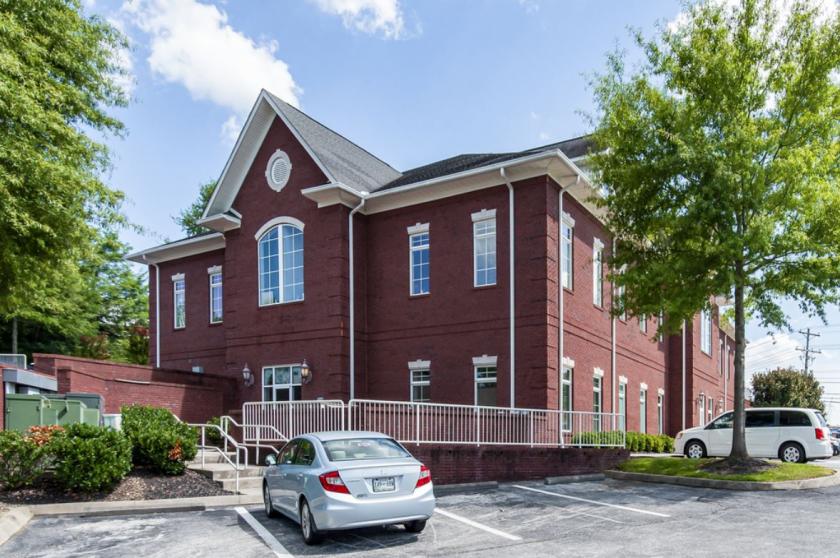
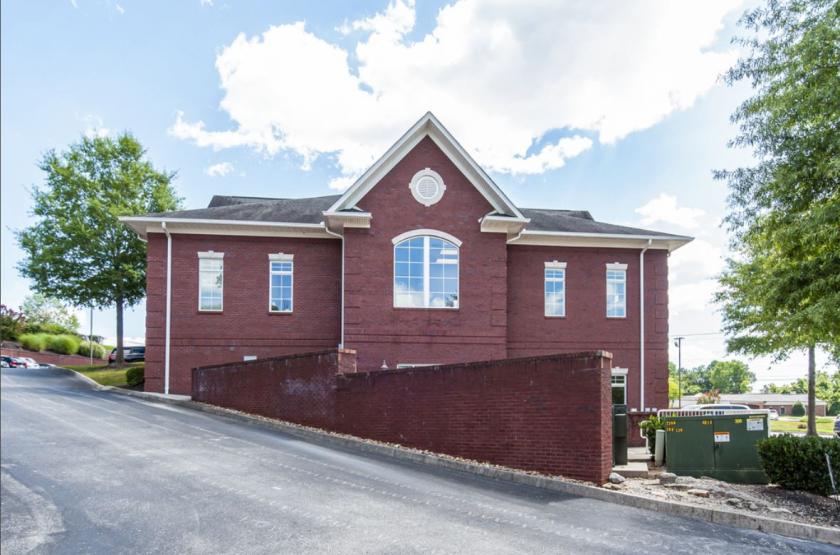
1-Mile | 3-Miles | 5-Miles | ||
---|---|---|---|---|
Total Population | 2,237 | 16,926 | 30,802 | |
Population Median Age | 34 | 39 | 41 | |
Population by Age | 0-9 Yrs | 469 (20%) | 2476 (14%) | 3754 (12%) |
10-19 Yrs | 238 (10%) | 1903 (11%) | 3864 (12%) | |
20-29 Yrs | 337 (15%) | 2114 (12%) | 3269 (10%) | |
30-39 Yrs | 316 (14%) | 2332 (13%) | 3743 (12%) | |
40-49 Yrs | 216 (9%) | 1799 (10%) | 3572 (11%) | |
50-59 Yrs | 313 (13%) | 2522 (14%) | 4615 (14%) | |
60-69 Yrs | 166 (7%) | 2123 (12%) | 4234 (13%) | |
70+ Yrs | 183 (8%) | 1657 (9%) | 3750 (12%) | |
Median HH Income | $52,487 | $53,077 | $61,353 | |
Total Household Income | < 24K | 220 (27%) | 1468 (23%) | 1988 (17%) |
25-49K | 149 (18%) | 1479 (23%) | 2463 (21%) | |
50-74K | 205 (25%) | 1463 (23%) | 2395 (21%) | |
75-99K | 95 (11%) | 691 (10%) | 1347 (11%) | |
100-199K | 110 (13%) | 1019 (16%) | 2366 (20%) | |
200K+ | 15 (1%) | 199 (3%) | 782 (6%) | |
Highest Education Level | No Diploma | 169 | 2000 | 2763 |
Diploma or GED | 523 | 4129 | 6679 | |
Some College | 324 | 2201 | 4037 | |
Assoc. Degree | 90 | 702 | 1332 | |
Bachelors Degree | 218 | 1684 | 4222 | |
Higher Degree | 81 | 794 | 2469 | |
Total Housing Units | 894 | 7,189 | 12,599 | |
--Owner-Occupied | 369 | 4,083 | 8,466 | |
--Renter-Occupied | 424 | 2,236 | 2,875 | |
Owner-Occupied Values | < 100K | 123 | 934 | 1464 |
100-199K | 118 | 1511 | 2314 | |
200-299K | 88 | 904 | 1837 | |
300-399K | 29 | 299 | 1068 | |
400-499K | 11 | 307 | 871 | |
500K+ | 1 | 127 | 913 | |
Total Working Age Population | 1,622 | 13,412 | 24,714 | |
In Work Force | 998 | 8,050 | 14,569 | |
Not In Work Force | 625 | 5,362 | 10,146 | |
Workforce Employed | 922 | 7,575 | 13,791 | |
Workforce Unemployed | 76 | 475 | 775 | |
Civlian Workforce | 998 | 8,050 | 14,567 | |
Military Workforce | 0 | 0 | 2 | |
Total Households | 793 | 6,318 | 11,341 | |
Family Households | 519 | 4,356 | 8,435 | |
Non-Family Households | 275 | 1,962 | 2,906 | |
Married Couple | 367 | 3,250 | 6,815 | |
Other Family | 151 | 1,107 | 1,620 | |
Married w/Child | 156 | 1,043 | 2,223 | |
Single Male w/Child | 6 | 162 | 204 | |
Single Female w/Child | 69 | 426 | 550 |
Population Change Last Two Decades - Plus Projection
2000 | % | 2010 | % | 2020 | % | 2030 | |
---|---|---|---|---|---|---|---|
Tennessee | 5,689,283 | +12 | 6,346,105 | +9 | 6,886,369 | +7 | 7,393,069 |
Knox County | 382,032 | +13 | 432,226 | +10 | 473,996 | +8 | 513,318 |
Roane County | 51,910 | +4 | 54,181 | -2 | 53,285 | 0 | 53,111 |
Loudon County | 39,086 | +24 | 48,556 | +12 | 54,454 | +11 | 60,311 |
Total Working Age Population:
Total Households:
Total Working Age Population:
Total Households:
Total Working Age Population:
Total Households: