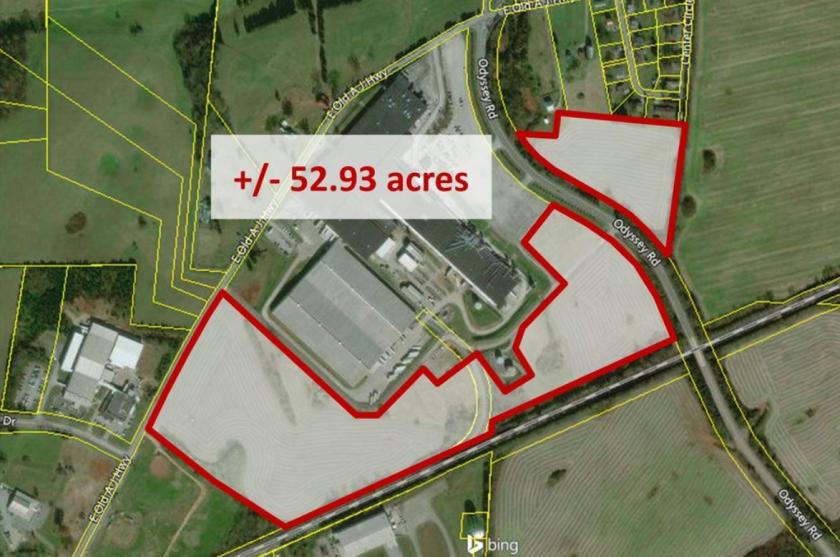
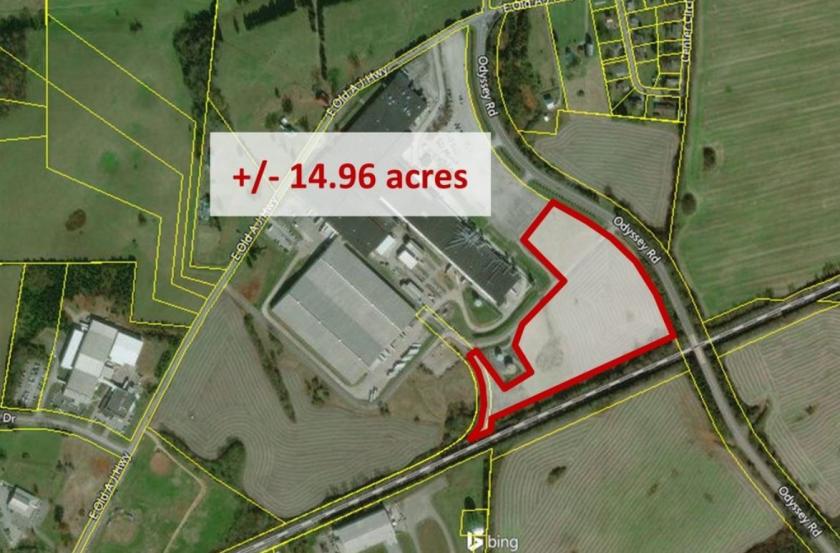
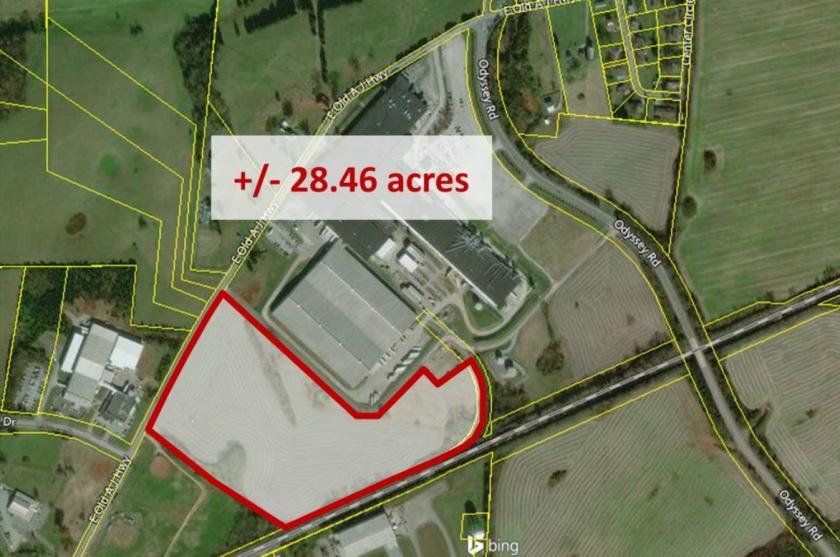
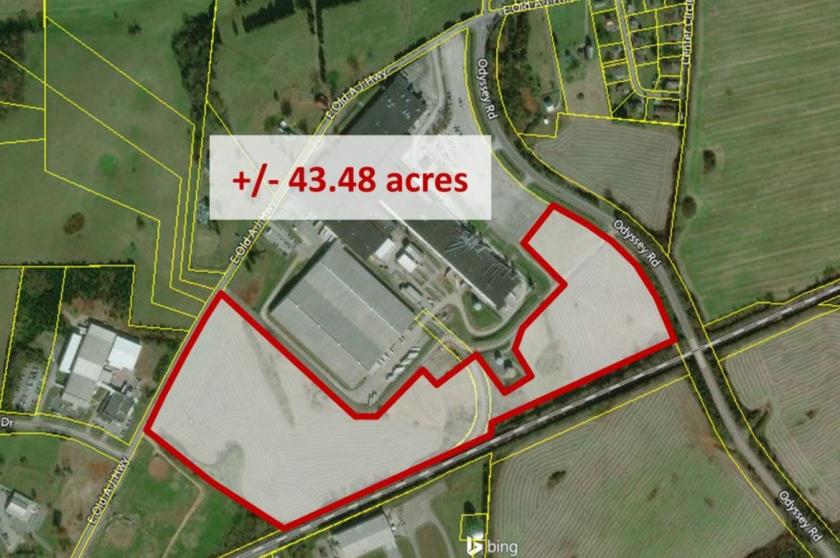
1-Mile | 3-Miles | 5-Miles | ||
---|---|---|---|---|
Total Population | 971 | 10,620 | 20,678 | |
Population Median Age | 41 | 39 | 39 | |
Population by Age | 0-9 Yrs | 107 (11%) | 1158 (10%) | 2241 (10%) |
10-19 Yrs | 142 (14%) | 1745 (16%) | 3276 (15%) | |
20-29 Yrs | 132 (13%) | 1525 (14%) | 2672 (12%) | |
30-39 Yrs | 132 (13%) | 1195 (11%) | 2104 (10%) | |
40-49 Yrs | 77 (7%) | 1285 (12%) | 2848 (13%) | |
50-59 Yrs | 111 (11%) | 1247 (11%) | 2656 (12%) | |
60-69 Yrs | 112 (11%) | 1189 (11%) | 2453 (11%) | |
70+ Yrs | 158 (16%) | 1275 (12%) | 2429 (11%) | |
Median HH Income | $37,529 | $41,051 | $48,002 | |
Total Household Income | < 24K | 111 (29%) | 1186 (30%) | 1900 (25%) |
25-49K | 103 (27%) | 988 (25%) | 1937 (26%) | |
50-74K | 49 (13%) | 599 (15%) | 1304 (17%) | |
75-99K | 56 (14%) | 473 (12%) | 977 (13%) | |
100-199K | 54 (14%) | 486 (12%) | 1101 (14%) | |
200K+ | 3 (0%) | 95 (2%) | 190 (2%) | |
Highest Education Level | No Diploma | 133 | 1251 | 2311 |
Diploma or GED | 242 | 2329 | 4951 | |
Some College | 102 | 1372 | 2790 | |
Assoc. Degree | 33 | 442 | 989 | |
Bachelors Degree | 91 | 968 | 1744 | |
Higher Degree | 48 | 358 | 841 | |
Total Housing Units | 413 | 4,366 | 8,298 | |
--Owner-Occupied | 242 | 2,329 | 5,131 | |
--Renter-Occupied | 133 | 1,498 | 2,278 | |
Owner-Occupied Values | < 100K | 61 | 641 | 1425 |
100-199K | 152 | 1201 | 2517 | |
200-299K | 9 | 232 | 602 | |
300-399K | 20 | 154 | 322 | |
400-499K | 0 | 51 | 97 | |
500K+ | 0 | 49 | 168 | |
Total Working Age Population | 776 | 8,729 | 16,726 | |
In Work Force | 415 | 4,703 | 9,527 | |
Not In Work Force | 360 | 4,026 | 7,199 | |
Workforce Employed | 391 | 4,462 | 9,012 | |
Workforce Unemployed | 25 | 242 | 515 | |
Civlian Workforce | 415 | 4,703 | 9,527 | |
Military Workforce | 0 | 0 | 0 | |
Total Households | 375 | 3,827 | 7,408 | |
Family Households | 227 | 2,417 | 5,087 | |
Non-Family Households | 147 | 1,410 | 2,322 | |
Married Couple | 187 | 1,827 | 4,039 | |
Other Family | 40 | 590 | 1,048 | |
Married w/Child | 61 | 666 | 1,488 | |
Single Male w/Child | 5 | 115 | 160 | |
Single Female w/Child | 18 | 201 | 324 |
Population Change Last Two Decades - Plus Projection
2000 | % | 2010 | % | 2020 | % | 2030 | |
---|---|---|---|---|---|---|---|
Tennessee | 5,689,283 | +12 | 6,346,105 | +9 | 6,886,369 | +7 | 7,393,069 |
Grainger County | 20,659 | +10 | 22,657 | +3 | 23,388 | +3 | 24,069 |
Hamblen County | 58,128 | +8 | 62,544 | +4 | 65,234 | +4 | 68,146 |
Jefferson County | 44,294 | +16 | 51,407 | +7 | 54,900 | +6 | 58,295 |
Total Working Age Population:
Total Households:
Total Working Age Population:
Total Households:
Total Working Age Population:
Total Households: