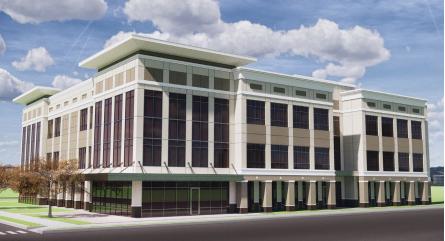
• 3 Story New Construction Building – estimated delivery
August 2021
• 54,000± RSF of Office/Medical space
• Minimum 5,400± RSF of Retail/Restaurant space
• Great Visibility on the highly traveled Orange Avenue
• In the heart of the SoDo Medical corridor, blocks from the
Orlando Health Campus
• Surrounded by an abundance of Restaurants, Retail &
Banking
• Minutes from Downtown Orlando with easy access to
Interstate 4 and SR 408
• Covered parking in 300 stall parking garage
• Lease Rate: Contact Broker for Details
No part of this information may be copied, reproduced, repurposed, or screen-captured for any commercial purpose without prior written authorization from MyEListing.
While we strive to provide the most accurate information, all listing information, and demographic data, is provided by third-parties. As such, MyEListing will not be responsible for the accuracy of the information. It is strongly recommended that you verify all information with the listing agent, and any relevant agencies, prior to making any decisions.
What is the building size of this commercial Office property?
The size of this multi-unit property varies between 5400 - 54000 square feet
What kind of Office is the propery at 2116 South Orange Avenue?
The property at 2116 South Orange Avenue Orlando, FL 32806 is listed as a Professional Office property
What is the population within 1 mile of 2116 South Orange Avenue in Orlando?
The population within 1 mile of 2116 South Orange Avenue Orlando, FL 32806 is 9,773 people.
Who do I contact for questions about 2116 South Orange Avenue?
You should contact the listing agent,
Buffy Gillette, for any details regarding this commercial listing.