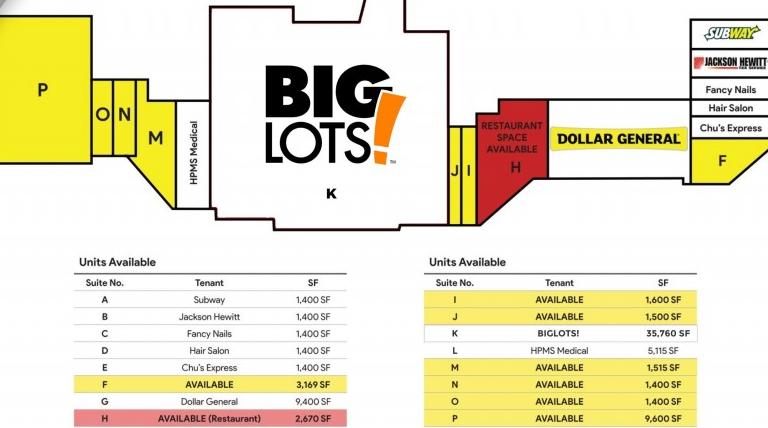
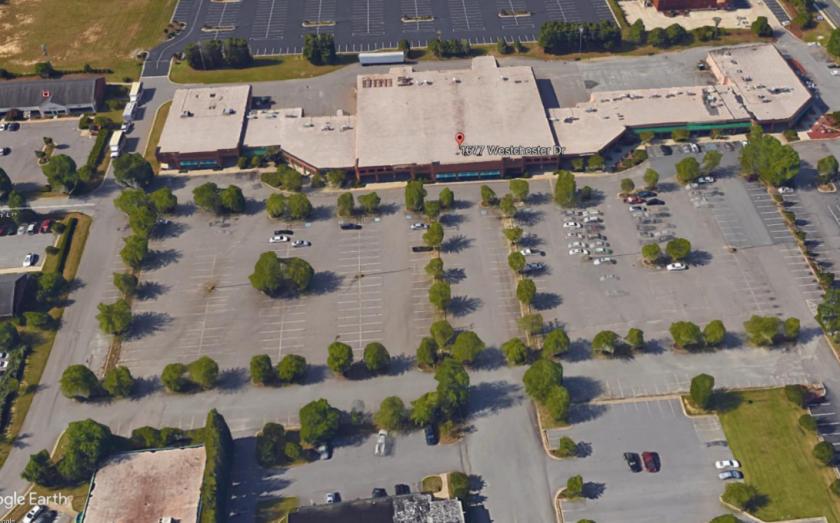
1-Mile | 3-Miles | 5-Miles | ||
---|---|---|---|---|
Total Population | 5,954 | 44,827 | 101,544 | |
Population Median Age | 40 | 36 | 38 | |
Population by Age | 0-9 Yrs | 698 (11%) | 6093 (13%) | 13291 (13%) |
10-19 Yrs | 888 (14%) | 7557 (16%) | 15148 (14%) | |
20-29 Yrs | 710 (11%) | 6490 (14%) | 13937 (13%) | |
30-39 Yrs | 758 (12%) | 5149 (11%) | 12513 (12%) | |
40-49 Yrs | 670 (11%) | 5340 (11%) | 12593 (12%) | |
50-59 Yrs | 740 (12%) | 5649 (12%) | 13463 (13%) | |
60-69 Yrs | 626 (10%) | 4277 (9%) | 10129 (9%) | |
70+ Yrs | 862 (14%) | 4272 (9%) | 10471 (10%) | |
Median HH Income | $41,113 | $33,900 | $37,844 | |
Total Household Income | < 24K | 630 (29%) | 6087 (37%) | 12042 (31%) |
25-49K | 617 (28%) | 5009 (30%) | 12186 (31%) | |
50-74K | 291 (13%) | 2299 (14%) | 6014 (15%) | |
75-99K | 135 (6%) | 961 (5%) | 3281 (8%) | |
100-199K | 332 (15%) | 1568 (9%) | 3957 (10%) | |
200K+ | 127 (5%) | 465 (2%) | 881 (2%) | |
Highest Education Level | No Diploma | 732 | 5955 | 12615 |
Diploma or GED | 942 | 7502 | 19471 | |
Some College | 712 | 6175 | 14447 | |
Assoc. Degree | 321 | 2183 | 5802 | |
Bachelors Degree | 826 | 4077 | 9615 | |
Higher Degree | 466 | 1860 | 3939 | |
Total Housing Units | 2,485 | 19,244 | 43,742 | |
--Owner-Occupied | 1,171 | 7,169 | 20,180 | |
--Renter-Occupied | 961 | 9,220 | 18,179 | |
Owner-Occupied Values | < 100K | 311 | 2665 | 7195 |
100-199K | 392 | 2590 | 8873 | |
200-299K | 267 | 982 | 2527 | |
300-399K | 80 | 379 | 680 | |
400-499K | 46 | 239 | 375 | |
500K+ | 74 | 315 | 530 | |
Total Working Age Population | 4,785 | 34,706 | 79,794 | |
In Work Force | 2,810 | 20,437 | 48,121 | |
Not In Work Force | 1,975 | 14,268 | 31,673 | |
Workforce Employed | 2,518 | 18,256 | 43,559 | |
Workforce Unemployed | 292 | 2,177 | 4,504 | |
Civlian Workforce | 2,810 | 20,433 | 48,063 | |
Military Workforce | 0 | 4 | 58 | |
Total Households | 2,132 | 16,389 | 38,359 | |
Family Households | 1,406 | 10,266 | 24,675 | |
Non-Family Households | 725 | 6,123 | 13,684 | |
Married Couple | 888 | 5,507 | 14,926 | |
Other Family | 519 | 4,759 | 9,749 | |
Married w/Child | 290 | 2,219 | 5,869 | |
Single Male w/Child | 97 | 536 | 987 | |
Single Female w/Child | 235 | 2,462 | 4,807 |
Population Change Last Two Decades - Plus Projection
2000 | % | 2010 | % | 2020 | % | 2030 | |
---|---|---|---|---|---|---|---|
North Carolina | 8,049,313 | +18 | 9,535,483 | +12 | 10,647,005 | +11 | 11,847,719 |
Davidson County | 147,246 | +11 | 162,878 | +4 | 169,834 | +6 | 180,208 |
Guilford County | 421,048 | +16 | 488,406 | +12 | 544,715 | +11 | 606,724 |
Randolph County | 130,454 | +9 | 141,752 | +2 | 144,344 | +2 | 146,524 |
Forsyth County | 306,067 | +15 | 350,670 | +10 | 385,208 | +10 | 423,006 |
Total Working Age Population:
Total Households:
Total Working Age Population:
Total Households:
Total Working Age Population:
Total Households: