Specialty Real Estate
2017 Morris Avenue Birmingham, AL 35203
2017 Morris Avenue Birmingham, AL 35203

Details & Description
Property Highlights
• Landlord owns a 16 space parking lot less than one block (300 feet) away that can also be leased to a tenant.
• Across the street from Founders Station and Shipt HQ. Walkable to everything in the CBD and Parkside District.
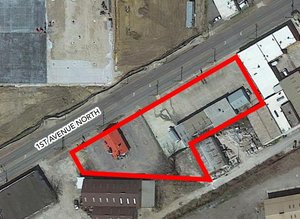
Additional Photos


Listing Agents

John Tally
O: 205-458-8021
jtally@harbertrealty.com
O: 205-458-8021
jtally@harbertrealty.com
While we strive to provide the most accurate information, all listing information, and demographic data, is provided by third-parties. As such, MyEListing will not be responsible for the accuracy of the information. It is strongly recommended that you verify all information with the listing agent, and any relevant agencies, prior to making any decisions.