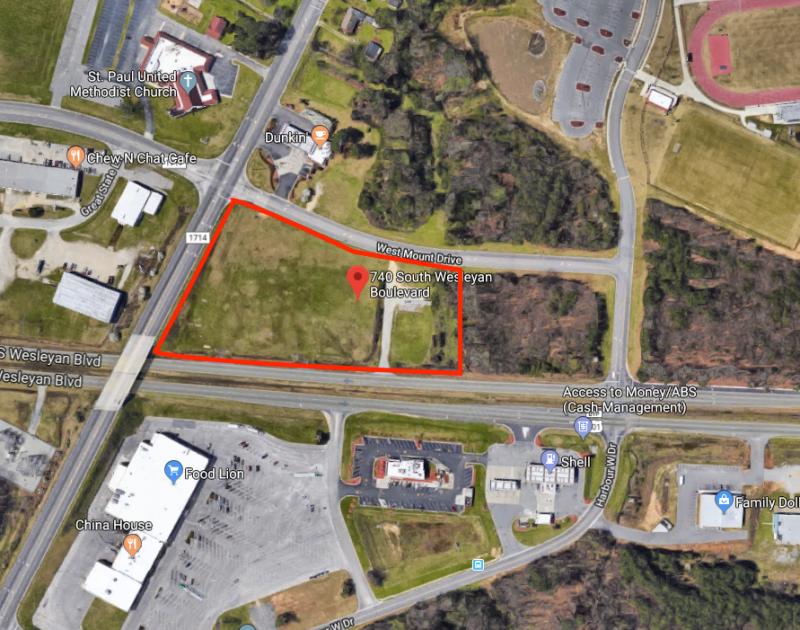
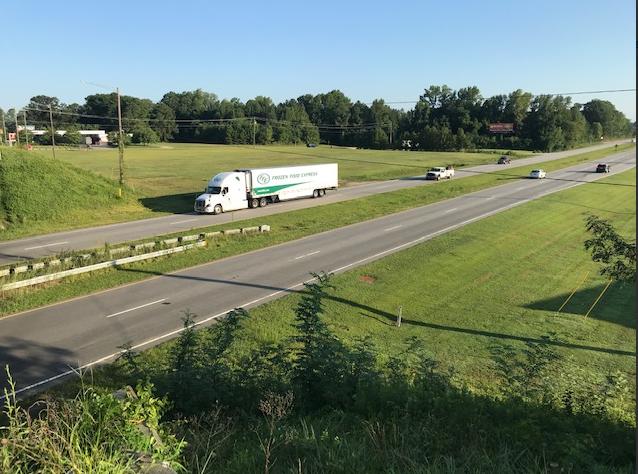
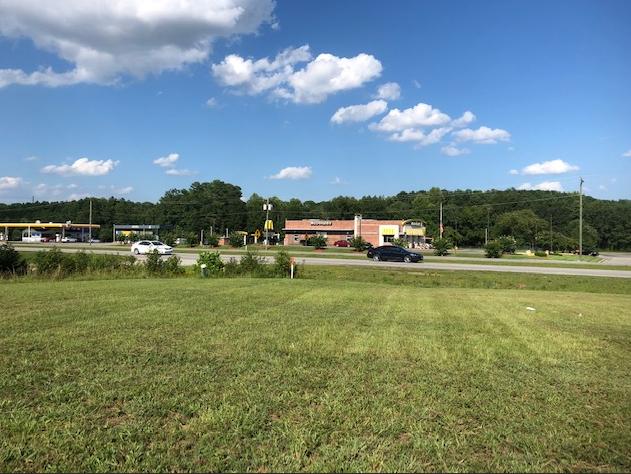
Located on highway 301 in Rocky Mount NC, these 4 side by side vacant parcels of land are ready for development. These parcels are street leveled and the amount of acreage in each lot ranges from 0.89 to 1.29. These properties are perfect for retail or hotel development as they have a high traffic volume and are right across from McDonalds, Family Dollar, Food Lion, and more. They are also located on an intersection that contains the local high school, a Speedway c-store, and a small strip mall that contains local businesses. The highway that these parcels are on lead directly into Rocky Mount and Wilson NC. Don’t miss an opportunity to invest in a piece of real estate that is located in a city that is right in-between New York and Florida (right off I-95), has recently added a brewery mill, is bringing in multiple industries (Example = CSX), and just opened a 165,000 sq ft event center!This 4.00 acre parcel is divided into 4 individual lots. Owner will consider selling individual lots at $4.25 per square foot.Traffic Count:Highway 301 = 26,000Bethlehem Rd = 11,000Zoning = Commercial Corridor District (B2)– The B2 District is established for major retail and service activities removed from the central business district, with major arterial access and with adequate open space and parking. This district is intended to serve the resident, non-residents and transient traffic using major arterials that run through or around the city.