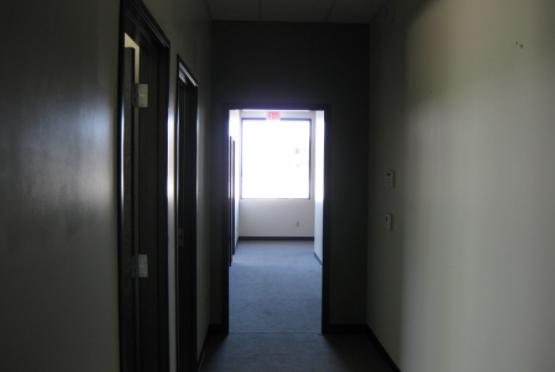
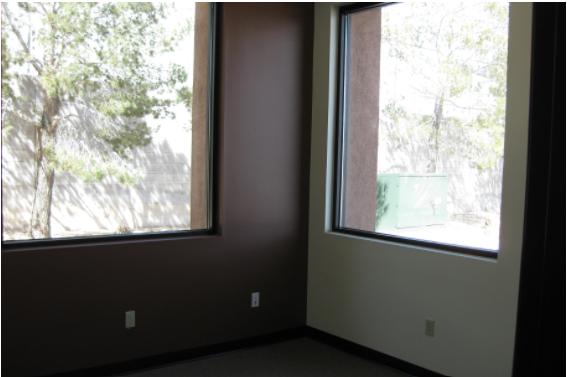
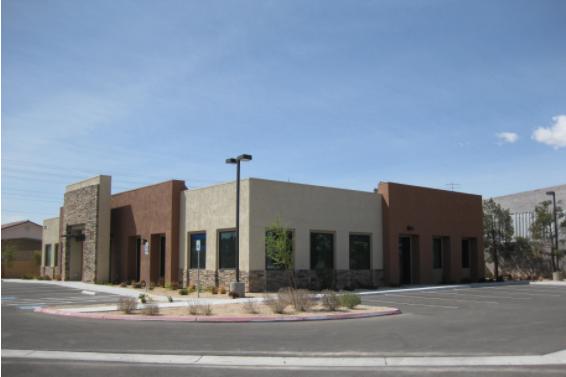
1-Mile | 3-Miles | 5-Miles | ||
---|---|---|---|---|
Total Population | 13,428 | 138,455 | 340,731 | |
Population Median Age | 36 | 39 | 39 | |
Population by Age | 0-9 Yrs | 1569 (11%) | 15620 (11%) | 38516 (11%) |
10-19 Yrs | 1986 (14%) | 17006 (12%) | 40962 (12%) | |
20-29 Yrs | 2467 (18%) | 20529 (14%) | 48524 (14%) | |
30-39 Yrs | 1904 (14%) | 19987 (14%) | 48287 (14%) | |
40-49 Yrs | 2058 (15%) | 19102 (13%) | 46058 (13%) | |
50-59 Yrs | 1289 (9%) | 18101 (13%) | 45645 (13%) | |
60-69 Yrs | 1130 (8%) | 15101 (10%) | 38370 (11%) | |
70+ Yrs | 1025 (7%) | 13009 (9%) | 34372 (10%) | |
Median HH Income | $44,156 | $54,684 | $52,936 | |
Total Household Income | < 24K | 1117 (21%) | 10220 (19%) | 27632 (21%) |
25-49K | 1689 (32%) | 13632 (26%) | 33928 (26%) | |
50-74K | 1045 (20%) | 10960 (21%) | 25747 (19%) | |
75-99K | 544 (10%) | 6685 (12%) | 15733 (12%) | |
100-199K | 616 (12%) | 8299 (16%) | 21608 (16%) | |
200K+ | 119 (2%) | 1886 (3%) | 5031 (3%) | |
Highest Education Level | No Diploma | 939 | 12193 | 31810 |
Diploma or GED | 2643 | 29030 | 71415 | |
Some College | 2373 | 25746 | 61677 | |
Assoc. Degree | 677 | 7050 | 17265 | |
Bachelors Degree | 1410 | 14519 | 37288 | |
Higher Degree | 633 | 7772 | 19888 | |
Total Housing Units | 5,766 | 58,328 | 146,703 | |
--Owner-Occupied | 2,035 | 26,683 | 65,770 | |
--Renter-Occupied | 3,096 | 24,999 | 63,909 | |
Owner-Occupied Values | < 100K | 306 | 3605 | 9939 |
100-199K | 661 | 9171 | 20547 | |
200-299K | 550 | 8622 | 18875 | |
300-399K | 325 | 3179 | 9294 | |
400-499K | 136 | 1065 | 4068 | |
500K+ | 57 | 1041 | 3048 | |
Total Working Age Population | 10,715 | 112,891 | 277,499 | |
In Work Force | 7,703 | 74,661 | 181,794 | |
Not In Work Force | 3,012 | 38,230 | 95,706 | |
Workforce Employed | 7,091 | 68,606 | 167,224 | |
Workforce Unemployed | 611 | 5,995 | 14,308 | |
Civlian Workforce | 7,703 | 74,601 | 181,532 | |
Military Workforce | 0 | 60 | 261 | |
Total Households | 5,131 | 51,681 | 129,679 | |
Family Households | 3,051 | 31,943 | 78,043 | |
Non-Family Households | 2,080 | 19,738 | 51,636 | |
Married Couple | 1,853 | 20,665 | 51,743 | |
Other Family | 1,198 | 11,278 | 26,299 | |
Married w/Child | 816 | 7,939 | 19,367 | |
Single Male w/Child | 85 | 1,331 | 3,248 | |
Single Female w/Child | 494 | 3,689 | 8,939 |
Population Change Last Two Decades - Plus Projection
2000 | % | 2010 | % | 2020 | % | 2030 | |
---|---|---|---|---|---|---|---|
Nevada | 1,998,257 | +35 | 2,700,551 | +17 | 3,149,234 | +10 | 3,460,728 |
Clark County | 1,375,765 | +42 | 1,951,269 | +19 | 2,318,174 | +10 | 2,550,048 |
Total Working Age Population:
Total Households:
Total Working Age Population:
Total Households:
Total Working Age Population:
Total Households: