Newly renovated lobby, common areas
and hallways
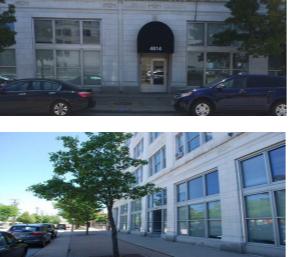
Currently up to 6,000 SF of office space for
lease in this 5-story building with spaces
starting at 300 SF
Restaurant space available on first floor
Rent/SF/Yr: starting at $11.00/+electric
Well maintained building, located in the
heart of The Midtown Corridor, listed in
the National Registry of Historic Places
Naming rights available
Property offers secure parking and
building offers 24-hour access via a key
card system
Join existing tenants: AARP, Cleveland
Christian Home, Kokosing Construction,
Adoption Network Cleveland, Just Energy
Solutions, Big Brothers Big Sisters & More
No part of this information may be copied, reproduced, repurposed, or screen-captured for any commercial purpose without prior written authorization from MyEListing.
While we strive to provide the most accurate information, all listing information, and demographic data, is provided by third-parties. As such, MyEListing will not be responsible for the accuracy of the information. It is strongly recommended that you verify all information with the listing agent, and any relevant agencies, prior to making any decisions.
What is the building size of this commercial Office property?
The size of this multi-unit property varies between 300 - 6000 square feet
What kind of Office is the propery at 4614 Prospect Avenue East?
The property at 4614 Prospect Avenue East Cleveland, OH 44103 is listed as a Professional Office property
What is the population within 1 mile of 4614 Prospect Avenue East in Cleveland?
The population within 1 mile of 4614 Prospect Avenue East Cleveland, OH 44103 is 14,588 people.
Who do I contact for questions about 4614 Prospect Avenue East?
You should contact the listing agent,
Chuck Essreg, for any details regarding this commercial listing.