Office Space
33 Clinton Road West Caldwell, NJ 07006
33 Clinton Road West Caldwell, NJ 07006
Details & Description
Property Highlights
• Free parking in attached parking lot
• Free parking in attached parking lot
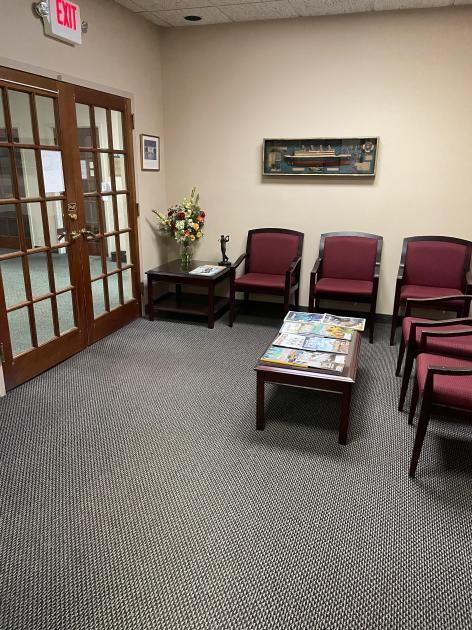
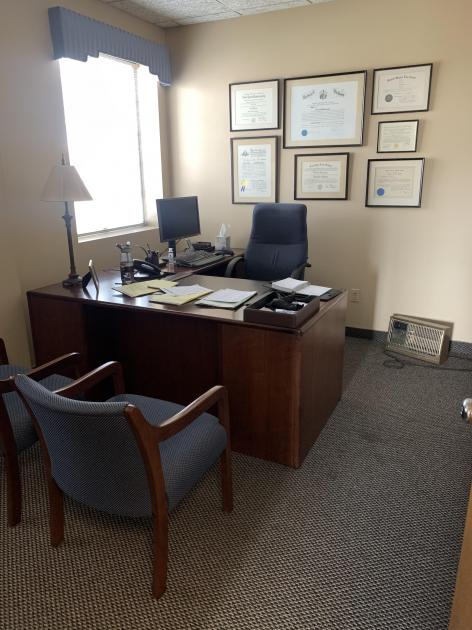
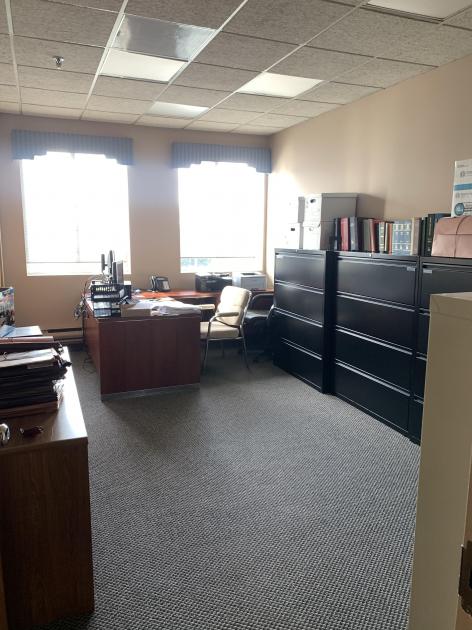
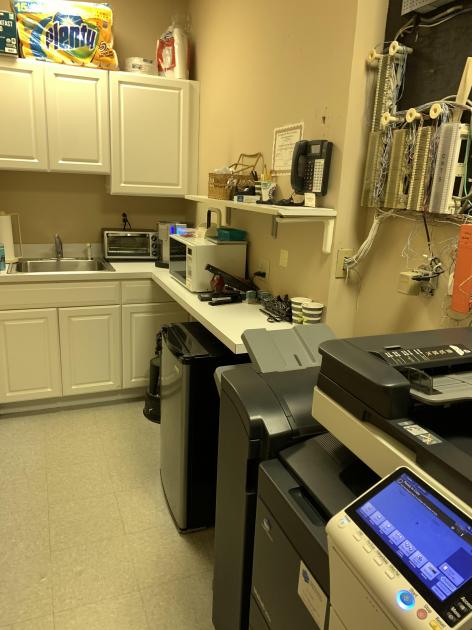
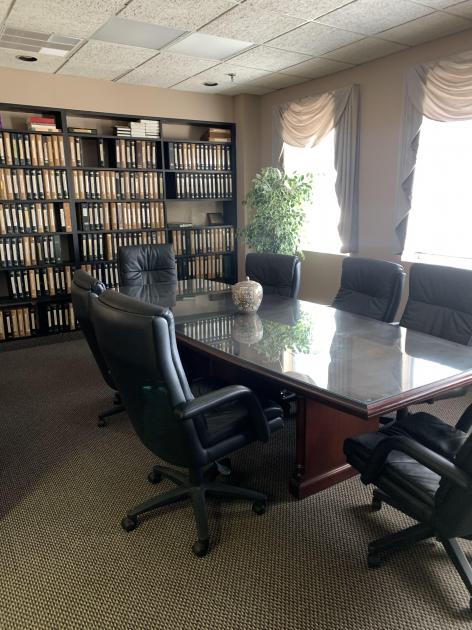
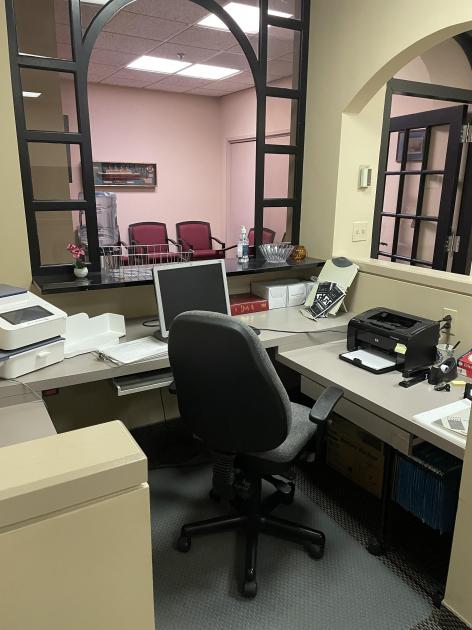
Additional Photos

Listing Agents

Steven Lehr
slehresq@gmail.com
slehresq@gmail.com
While we strive to provide the most accurate information, all listing information, and demographic data, is provided by third-parties. As such, MyEListing will not be responsible for the accuracy of the information. It is strongly recommended that you verify all information with the listing agent, and any relevant agencies, prior to making any decisions.