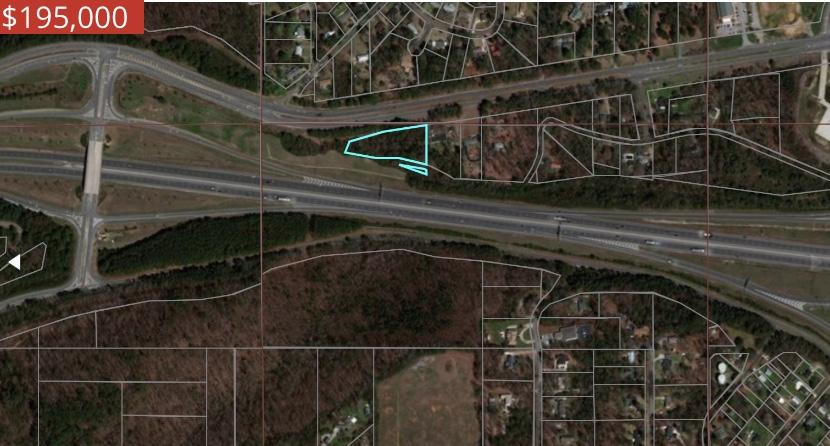
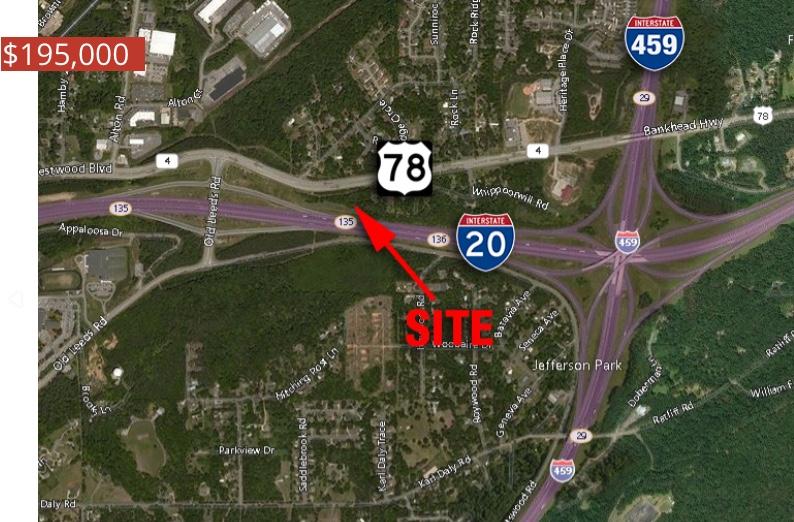
1-Mile | 3-Miles | 5-Miles | ||
---|---|---|---|---|
Total Population | 922 | 25,496 | 82,509 | |
Population Median Age | 41 | 39 | 38 | |
Population by Age | 0-9 Yrs | 113 (12%) | 3167 (12%) | 11054 (13%) |
10-19 Yrs | 68 (7%) | 3234 (12%) | 10437 (12%) | |
20-29 Yrs | 151 (16%) | 3008 (11%) | 10601 (12%) | |
30-39 Yrs | 144 (15%) | 3569 (13%) | 11219 (13%) | |
40-49 Yrs | 67 (7%) | 2980 (11%) | 10480 (12%) | |
50-59 Yrs | 128 (13%) | 3652 (14%) | 11428 (13%) | |
60-69 Yrs | 157 (17%) | 3288 (12%) | 9256 (11%) | |
70+ Yrs | 94 (10%) | 2599 (10%) | 8034 (9%) | |
Median HH Income | $50,579 | $43,394 | $52,336 | |
Total Household Income | < 24K | 77 (19%) | 3146 (30%) | 8562 (26%) |
25-49K | 118 (30%) | 2369 (22%) | 7125 (21%) | |
50-74K | 83 (21%) | 1813 (17%) | 5365 (16%) | |
75-99K | 59 (15%) | 1212 (11%) | 3913 (12%) | |
100-199K | 35 (8%) | 1416 (13%) | 5323 (16%) | |
200K+ | 20 (5%) | 413 (3%) | 2233 (6%) | |
Highest Education Level | No Diploma | 66 | 2266 | 6551 |
Diploma or GED | 171 | 5056 | 14503 | |
Some College | 86 | 3674 | 11212 | |
Assoc. Degree | 54 | 1379 | 4580 | |
Bachelors Degree | 224 | 3523 | 11721 | |
Higher Degree | 58 | 1919 | 8189 | |
Total Housing Units | 408 | 12,012 | 37,879 | |
--Owner-Occupied | 337 | 6,615 | 21,186 | |
--Renter-Occupied | 55 | 3,755 | 11,334 | |
Owner-Occupied Values | < 100K | 80 | 2459 | 6706 |
100-199K | 176 | 2724 | 6835 | |
200-299K | 64 | 663 | 3151 | |
300-399K | 8 | 250 | 1302 | |
400-499K | 4 | 132 | 869 | |
500K+ | 6 | 386 | 2324 | |
Total Working Age Population | 768 | 20,349 | 64,906 | |
In Work Force | 465 | 12,291 | 40,996 | |
Not In Work Force | 302 | 8,057 | 23,910 | |
Workforce Employed | 454 | 11,258 | 38,087 | |
Workforce Unemployed | 11 | 1,027 | 2,873 | |
Civlian Workforce | 465 | 12,285 | 40,960 | |
Military Workforce | 0 | 6 | 36 | |
Total Households | 392 | 10,370 | 32,520 | |
Family Households | 227 | 5,941 | 20,162 | |
Non-Family Households | 165 | 4,429 | 12,358 | |
Married Couple | 159 | 3,578 | 12,562 | |
Other Family | 68 | 2,363 | 7,601 | |
Married w/Child | 26 | 1,045 | 4,634 | |
Single Male w/Child | 10 | 157 | 552 | |
Single Female w/Child | 54 | 1,320 | 3,402 |
Population Change Last Two Decades - Plus Projection
2000 | % | 2010 | % | 2020 | % | 2030 | |
---|---|---|---|---|---|---|---|
Alabama | 4,447,100 | +7 | 4,779,736 | +3 | 4,940,253 | +4 | 5,124,380 |
Jefferson County | 662,047 | -1 | 658,466 | +1 | 662,458 | 0 | 665,244 |
Total Working Age Population:
Total Households:
Total Working Age Population:
Total Households:
Total Working Age Population:
Total Households: