Highlights
Excellent Power: 1200 Amps with 3-Phase
37,853 SF of Fully Conditioned Space
Close Proximity to Highway 29
Building completely Sprinkled
Completely Fenced Sub Zero Cooler Included
Two Paint Booths Included
Description
Heavy Commercial/Light Industrial Available for Sale on East Quintette Road! Formerly occupied by Honeycomb Aircraft Repair Center. With such a limited supply of quality industrial space available for sale in the Cantonment/Pensacola market, this opportunity is a rare find for an owner occupant seeking to build wealth through ownership.
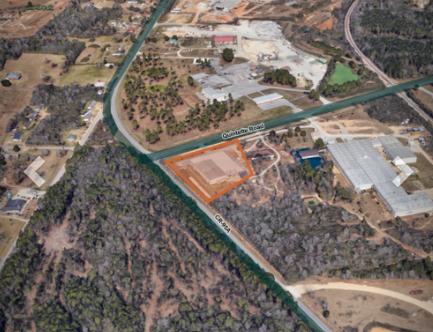
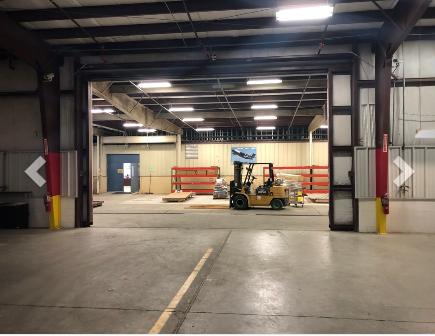
This property consists of 37,853 SF of fully conditioned warehouse space with approximately 500 SF of office space with the potential to expand office space significantly. The building is fully conditioned, sprinkled and has tremendous electrical capacity with 1200 AMPS and Three Phase throughout the building. The property itself sits on 2.33 acres on the corner of Highway 95A and East Quintette Road and is located less than two miles from Highway 29. There is one dock high door measuring 14 x 14 and two grade level doors measuring 10 x 14 and 12 x 10. The ceiling measures 21’ high with an 18’ eave height. Parking consists of 20 spaces up front with room for more parking in laydown yard.
Honeycomb Aircraft Repair Center will be occupying the building until December 31, 2020.
Location
Located on the corner of Highway 95-A and Quintette Road.
No part of this information may be copied, reproduced, repurposed, or screen-captured for any commercial purpose without prior written authorization from MyEListing.
While we strive to provide the most accurate information, all listing information, and demographic data, is provided by third-parties. As such, MyEListing will not be responsible for the accuracy of the information. It is strongly recommended that you verify all information with the listing agent, and any relevant agencies, prior to making any decisions.
What is the asking price for 1 East Quintette Road in Cantonment?
The asking price for 1 East Quintette Road is $2,226,480
What is the building size of this Industrial property in Cantonment, FL?
The size of the building/unit at 1 East Quintette Road in Cantonment is 37,853 square feet
How much land does the Cantonment, FL property at 1 East Quintette Road include?
1 East Quintette Road in Cantonment includes 2.337 acres of land
What kind of Industrial is the propery at 1 East Quintette Road?
The property at 1 East Quintette Road Cantonment, FL 32533 is listed as a Other Industrial Industrial property
What is the population within 1 mile of 1 East Quintette Road in Cantonment?
The population within 1 mile of 1 East Quintette Road Cantonment, FL 32533 is 713 people.
Who do I contact for questions about 1 East Quintette Road?
You should contact the listing agent,
Thomas McVoy, for any details regarding this commercial listing.