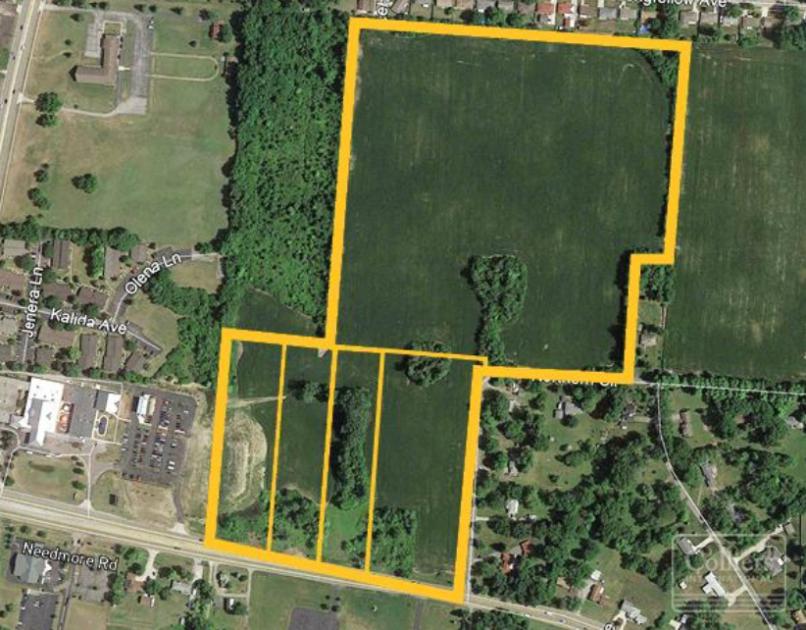
1-Mile | 3-Miles | 5-Miles | ||
---|---|---|---|---|
Total Population | 8,570 | 98,624 | 214,696 | |
Population Median Age | 41 | 36 | 37 | |
Population by Age | 0-9 Yrs | 548 (6%) | 11874 (12%) | 27174 (12%) |
10-19 Yrs | 708 (8%) | 15080 (15%) | 28686 (13%) | |
20-29 Yrs | 1759 (20%) | 19058 (19%) | 35834 (16%) | |
30-39 Yrs | 1488 (17%) | 12030 (12%) | 27512 (12%) | |
40-49 Yrs | 952 (11%) | 10952 (11%) | 24131 (11%) | |
50-59 Yrs | 1260 (14%) | 12451 (12%) | 28519 (13%) | |
60-69 Yrs | 1140 (13%) | 9460 (9%) | 22481 (10%) | |
70+ Yrs | 714 (8%) | 7720 (7%) | 20359 (9%) | |
Median HH Income | $25,077 | $30,382 | $36,364 | |
Total Household Income | < 24K | 2233 (49%) | 16898 (43%) | 33049 (36%) |
25-49K | 858 (19%) | 10142 (25%) | 24464 (26%) | |
50-74K | 633 (14%) | 6008 (15%) | 14817 (16%) | |
75-99K | 330 (7%) | 2721 (6%) | 8016 (8%) | |
100-199K | 301 (6%) | 2743 (6%) | 8554 (9%) | |
200K+ | 115 (2%) | 762 (1%) | 1729 (1%) | |
Highest Education Level | No Diploma | 1027 | 10669 | 20470 |
Diploma or GED | 1356 | 17017 | 40641 | |
Some College | 1546 | 15137 | 36379 | |
Assoc. Degree | 600 | 5070 | 12916 | |
Bachelors Degree | 1028 | 7400 | 17440 | |
Higher Degree | 1020 | 4841 | 12002 | |
Total Housing Units | 5,692 | 51,803 | 111,058 | |
--Owner-Occupied | 1,028 | 17,605 | 45,307 | |
--Renter-Occupied | 3,442 | 21,668 | 45,321 | |
Owner-Occupied Values | < 100K | 362 | 13505 | 31436 |
100-199K | 437 | 2318 | 9883 | |
200-299K | 146 | 795 | 2032 | |
300-399K | 35 | 428 | 949 | |
400-499K | 16 | 195 | 383 | |
500K+ | 32 | 363 | 624 | |
Total Working Age Population | 7,665 | 79,404 | 171,800 | |
In Work Force | 4,179 | 45,060 | 101,455 | |
Not In Work Force | 3,486 | 34,344 | 70,345 | |
Workforce Employed | 3,697 | 39,611 | 90,464 | |
Workforce Unemployed | 433 | 5,322 | 10,051 | |
Civlian Workforce | 4,130 | 44,933 | 100,514 | |
Military Workforce | 49 | 127 | 940 | |
Total Households | 4,470 | 39,273 | 90,628 | |
Family Households | 1,189 | 19,956 | 48,649 | |
Non-Family Households | 3,280 | 19,317 | 41,979 | |
Married Couple | 706 | 9,736 | 26,238 | |
Other Family | 483 | 10,220 | 22,411 | |
Married w/Child | 199 | 3,640 | 9,631 | |
Single Male w/Child | 37 | 1,102 | 2,628 | |
Single Female w/Child | 251 | 4,697 | 10,136 |
Population Change Last Two Decades - Plus Projection
2000 | % | 2010 | % | 2020 | % | 2030 | |
---|---|---|---|---|---|---|---|
Ohio | 11,353,140 | +2 | 11,536,504 | 0 | 11,574,870 | 0 | 11,615,100 |
Greene County | 147,886 | +9 | 161,573 | +2 | 164,940 | +1 | 165,780 |
Montgomery County | 559,062 | -4 | 535,153 | -4 | 513,830 | -3 | 496,650 |
Total Working Age Population:
Total Households:
Total Working Age Population:
Total Households:
Total Working Age Population:
Total Households: