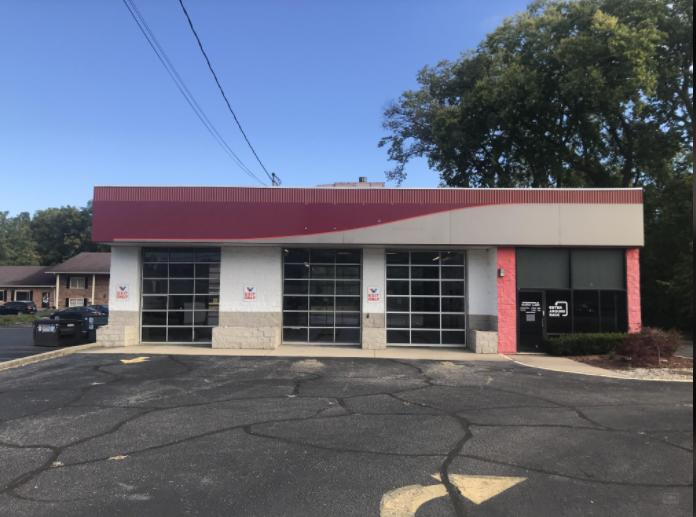
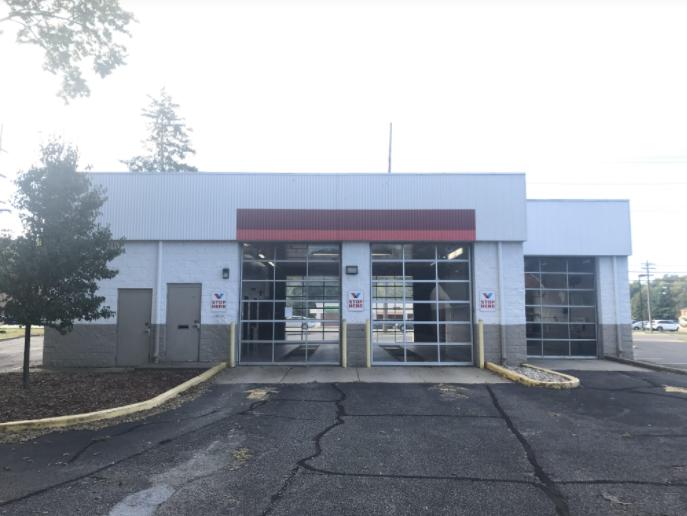
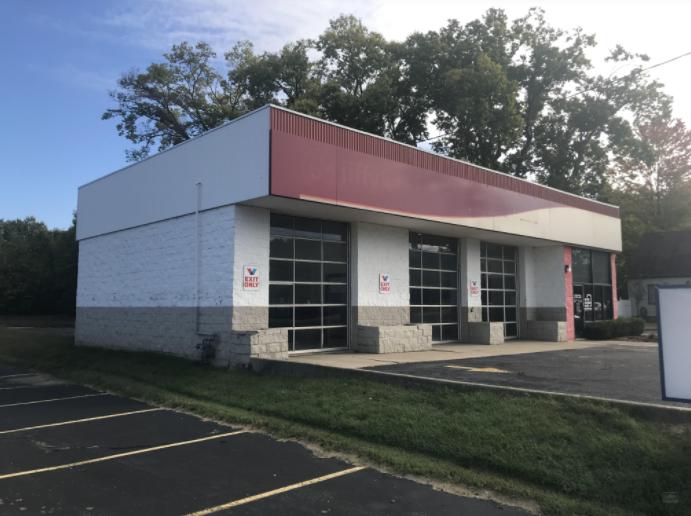
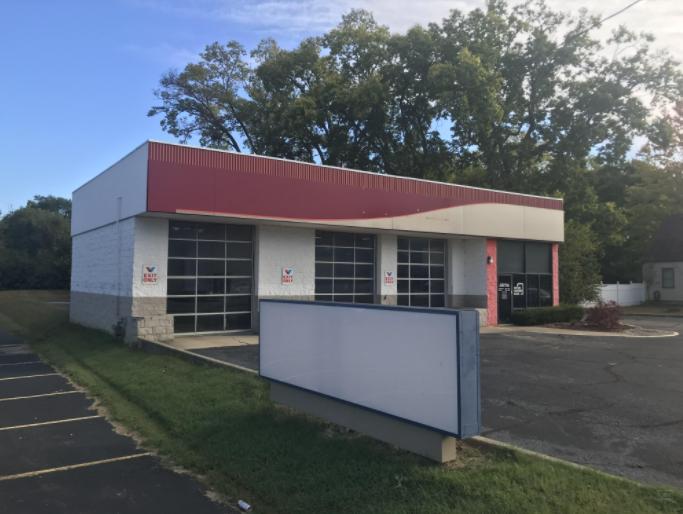
1-Mile | 3-Miles | 5-Miles | ||
---|---|---|---|---|
Total Population | 7,815 | 58,986 | 142,287 | |
Population Median Age | 41 | 38 | 38 | |
Population by Age | 0-9 Yrs | 982 (12%) | 7556 (12%) | 19732 (13%) |
10-19 Yrs | 1063 (13%) | 7193 (12%) | 18602 (13%) | |
20-29 Yrs | 693 (8%) | 8788 (14%) | 20544 (14%) | |
30-39 Yrs | 916 (11%) | 7207 (12%) | 17993 (12%) | |
40-49 Yrs | 1089 (13%) | 7320 (12%) | 17278 (12%) | |
50-59 Yrs | 1088 (13%) | 8640 (14%) | 19437 (13%) | |
60-69 Yrs | 890 (11%) | 6575 (11%) | 15455 (10%) | |
70+ Yrs | 1095 (14%) | 5707 (9%) | 13246 (9%) | |
Median HH Income | $58,891 | $58,300 | $56,735 | |
Total Household Income | < 24K | 439 (14%) | 3957 (17%) | 10559 (19%) |
25-49K | 810 (25%) | 5676 (24%) | 13172 (24%) | |
50-74K | 689 (22%) | 5101 (22%) | 11253 (20%) | |
75-99K | 447 (14%) | 3365 (14%) | 7483 (13%) | |
100-199K | 613 (19%) | 4213 (18%) | 9649 (17%) | |
200K+ | 127 (4%) | 735 (3%) | 1672 (3%) | |
Highest Education Level | No Diploma | 453 | 3991 | 10179 |
Diploma or GED | 1971 | 14195 | 32498 | |
Some College | 1218 | 8408 | 19575 | |
Assoc. Degree | 496 | 3670 | 8586 | |
Bachelors Degree | 814 | 6350 | 15036 | |
Higher Degree | 454 | 2937 | 7590 | |
Total Housing Units | 3,432 | 25,417 | 59,212 | |
--Owner-Occupied | 2,227 | 14,938 | 33,671 | |
--Renter-Occupied | 897 | 8,109 | 20,117 | |
Owner-Occupied Values | < 100K | 246 | 4318 | 10910 |
100-199K | 1484 | 7789 | 16037 | |
200-299K | 387 | 2249 | 4907 | |
300-399K | 58 | 309 | 1083 | |
400-499K | 11 | 109 | 261 | |
500K+ | 41 | 164 | 472 | |
Total Working Age Population | 6,147 | 46,782 | 110,516 | |
In Work Force | 4,018 | 32,146 | 73,201 | |
Not In Work Force | 2,129 | 14,636 | 37,315 | |
Workforce Employed | 3,905 | 30,600 | 69,091 | |
Workforce Unemployed | 113 | 1,534 | 4,026 | |
Civlian Workforce | 4,018 | 32,134 | 73,117 | |
Military Workforce | 0 | 12 | 84 | |
Total Households | 3,124 | 23,047 | 53,788 | |
Family Households | 2,100 | 14,745 | 34,981 | |
Non-Family Households | 1,024 | 8,302 | 18,807 | |
Married Couple | 1,534 | 10,437 | 23,884 | |
Other Family | 567 | 4,308 | 11,097 | |
Married w/Child | 581 | 3,947 | 9,218 | |
Single Male w/Child | 82 | 607 | 1,577 | |
Single Female w/Child | 190 | 1,665 | 4,714 |
Population Change Last Two Decades - Plus Projection
2000 | % | 2010 | % | 2020 | % | 2030 | |
---|---|---|---|---|---|---|---|
Ohio | 11,353,140 | +2 | 11,536,504 | 0 | 11,574,870 | 0 | 11,615,100 |
Hamilton County | 845,303 | -5 | 802,374 | -1 | 790,600 | -1 | 785,900 |
Butler County | 332,807 | +11 | 368,130 | +6 | 390,110 | +5 | 410,960 |
Total Working Age Population:
Total Households:
Total Working Age Population:
Total Households:
Total Working Age Population:
Total Households: