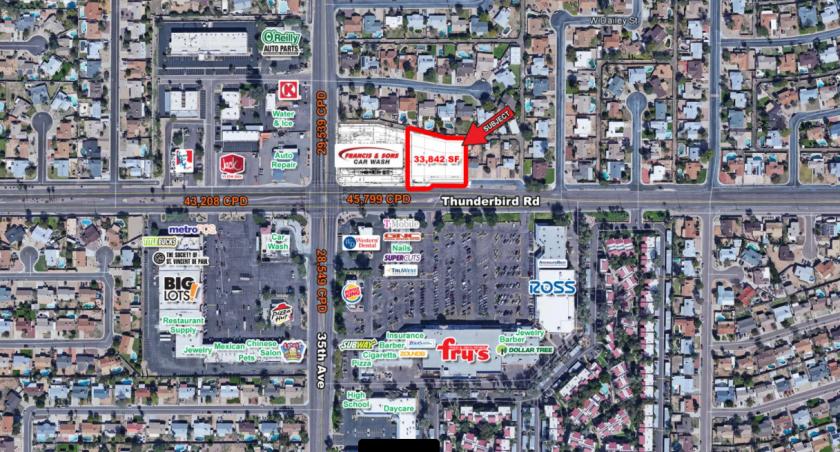
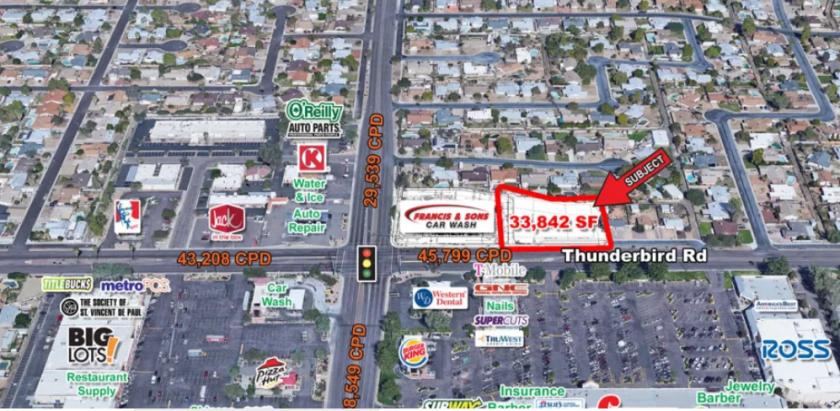
1-Mile | 3-Miles | 5-Miles | ||
---|---|---|---|---|
Total Population | 20,091 | 147,102 | 401,167 | |
Population Median Age | 37 | 37 | 37 | |
Population by Age | 0-9 Yrs | 2395 (11%) | 18880 (12%) | 52240 (13%) |
10-19 Yrs | 2572 (12%) | 18281 (12%) | 48517 (12%) | |
20-29 Yrs | 3655 (18%) | 22956 (15%) | 64324 (16%) | |
30-39 Yrs | 2877 (14%) | 20859 (14%) | 56160 (13%) | |
40-49 Yrs | 2602 (12%) | 18492 (12%) | 51476 (12%) | |
50-59 Yrs | 2504 (12%) | 19729 (13%) | 53222 (13%) | |
60-69 Yrs | 1870 (9%) | 14896 (10%) | 40981 (10%) | |
70+ Yrs | 1615 (8%) | 13010 (8%) | 34248 (8%) | |
Median HH Income | $51,585 | $53,550 | $53,356 | |
Total Household Income | < 24K | 1375 (19%) | 11069 (20%) | 31482 (21%) |
25-49K | 2027 (28%) | 13734 (25%) | 38123 (25%) | |
50-74K | 1657 (23%) | 11527 (21%) | 29587 (19%) | |
75-99K | 827 (11%) | 7479 (13%) | 19834 (13%) | |
100-199K | 968 (13%) | 8465 (15%) | 24447 (16%) | |
200K+ | 198 (2%) | 1149 (2%) | 4775 (3%) | |
Highest Education Level | No Diploma | 2082 | 12773 | 33161 |
Diploma or GED | 3704 | 27775 | 74846 | |
Some College | 3355 | 27493 | 72060 | |
Assoc. Degree | 1290 | 9565 | 25197 | |
Bachelors Degree | 2016 | 14793 | 42738 | |
Higher Degree | 987 | 6894 | 22665 | |
Total Housing Units | 7,544 | 58,531 | 162,531 | |
--Owner-Occupied | 4,351 | 30,051 | 82,264 | |
--Renter-Occupied | 2,700 | 23,372 | 65,985 | |
Owner-Occupied Values | < 100K | 369 | 3377 | 10817 |
100-199K | 2428 | 14563 | 35350 | |
200-299K | 1427 | 9557 | 23353 | |
300-399K | 84 | 1613 | 7350 | |
400-499K | 11 | 467 | 2812 | |
500K+ | 33 | 474 | 2582 | |
Total Working Age Population | 16,312 | 117,367 | 320,148 | |
In Work Force | 10,643 | 76,034 | 208,631 | |
Not In Work Force | 5,669 | 41,333 | 111,517 | |
Workforce Employed | 10,085 | 71,418 | 195,454 | |
Workforce Unemployed | 558 | 4,536 | 12,964 | |
Civlian Workforce | 10,643 | 75,954 | 208,418 | |
Military Workforce | 0 | 80 | 213 | |
Total Households | 7,052 | 53,423 | 148,248 | |
Family Households | 4,716 | 33,777 | 92,366 | |
Non-Family Households | 2,336 | 19,646 | 55,882 | |
Married Couple | 3,108 | 22,031 | 61,147 | |
Other Family | 1,608 | 11,746 | 31,219 | |
Married w/Child | 1,177 | 8,478 | 23,546 | |
Single Male w/Child | 354 | 2,008 | 4,709 | |
Single Female w/Child | 486 | 3,938 | 11,179 |
Population Change Last Two Decades - Plus Projection
2000 | % | 2010 | % | 2020 | % | 2030 | |
---|---|---|---|---|---|---|---|
Arizona | 5,130,632 | +25 | 6,392,017 | +14 | 7,286,100 | +14 | 8,284,900 |
Maricopa County | 3,072,149 | +24 | 3,817,117 | +16 | 4,436,900 | +15 | 5,107,700 |
Total Working Age Population:
Total Households:
Total Working Age Population:
Total Households:
Total Working Age Population:
Total Households: