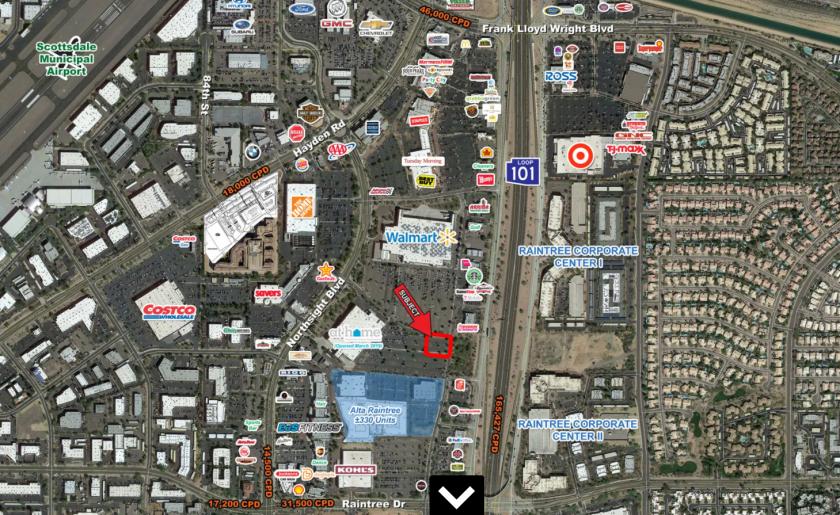
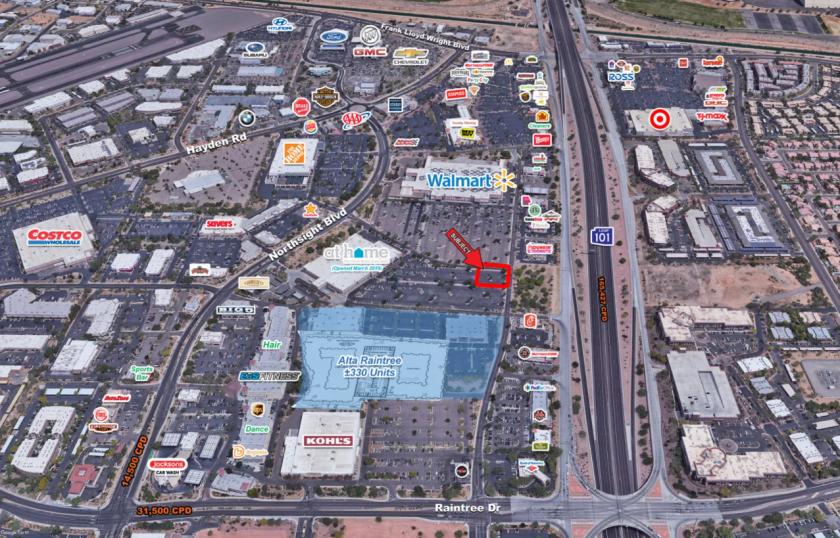
1-Mile | 3-Miles | 5-Miles | ||
---|---|---|---|---|
Total Population | 9,543 | 63,627 | 151,206 | |
Population Median Age | 42 | 44 | 44 | |
Population by Age | 0-9 Yrs | 760 (7%) | 6115 (9%) | 14101 (9%) |
10-19 Yrs | 883 (9%) | 7185 (11%) | 17574 (11%) | |
20-29 Yrs | 1160 (12%) | 5623 (8%) | 13719 (9%) | |
30-39 Yrs | 1696 (17%) | 7519 (11%) | 16761 (11%) | |
40-49 Yrs | 1387 (14%) | 9393 (14%) | 20805 (13%) | |
50-59 Yrs | 1312 (13%) | 10080 (15%) | 24289 (16%) | |
60-69 Yrs | 1104 (11%) | 8476 (13%) | 21323 (14%) | |
70+ Yrs | 1240 (12%) | 9235 (14%) | 22634 (14%) | |
Median HH Income | $81,722 | $95,734 | $96,027 | |
Total Household Income | < 24K | 467 (9%) | 2756 (9%) | 6864 (10%) |
25-49K | 859 (18%) | 4248 (15%) | 9530 (14%) | |
50-74K | 844 (17%) | 3897 (13%) | 9349 (14%) | |
75-99K | 796 (16%) | 3687 (13%) | 8221 (12%) | |
100-199K | 1367 (28%) | 8194 (29%) | 18946 (29%) | |
200K+ | 435 (9%) | 5136 (18%) | 12406 (18%) | |
Highest Education Level | No Diploma | 185 | 1052 | 2709 |
Diploma or GED | 1057 | 6076 | 13330 | |
Some College | 1527 | 8150 | 21002 | |
Assoc. Degree | 528 | 3459 | 7895 | |
Bachelors Degree | 2380 | 17107 | 40480 | |
Higher Degree | 1817 | 11851 | 27923 | |
Total Housing Units | 5,647 | 33,490 | 77,760 | |
--Owner-Occupied | 2,222 | 17,496 | 43,750 | |
--Renter-Occupied | 2,547 | 10,421 | 21,566 | |
Owner-Occupied Values | < 100K | 60 | 226 | 670 |
100-199K | 180 | 803 | 1860 | |
200-299K | 508 | 1918 | 4120 | |
300-399K | 462 | 3633 | 8677 | |
400-499K | 455 | 3407 | 8381 | |
500K+ | 557 | 7509 | 20041 | |
Total Working Age Population | 8,177 | 52,896 | 125,865 | |
In Work Force | 5,574 | 33,753 | 79,518 | |
Not In Work Force | 2,603 | 19,143 | 46,346 | |
Workforce Employed | 5,297 | 32,347 | 76,549 | |
Workforce Unemployed | 246 | 1,362 | 2,923 | |
Civlian Workforce | 5,544 | 33,709 | 79,471 | |
Military Workforce | 30 | 44 | 47 | |
Total Households | 4,768 | 27,917 | 65,316 | |
Family Households | 2,188 | 16,366 | 40,444 | |
Non-Family Households | 2,581 | 11,551 | 24,872 | |
Married Couple | 1,691 | 13,350 | 33,702 | |
Other Family | 497 | 3,016 | 6,742 | |
Married w/Child | 645 | 5,092 | 12,025 | |
Single Male w/Child | 18 | 389 | 920 | |
Single Female w/Child | 219 | 1,122 | 2,439 |
Population Change Last Two Decades - Plus Projection
2000 | % | 2010 | % | 2020 | % | 2030 | |
---|---|---|---|---|---|---|---|
Arizona | 5,130,632 | +25 | 6,392,017 | +14 | 7,286,100 | +14 | 8,284,900 |
Maricopa County | 3,072,149 | +24 | 3,817,117 | +16 | 4,436,900 | +15 | 5,107,700 |
Total Working Age Population:
Total Households:
Total Working Age Population:
Total Households:
Total Working Age Population:
Total Households: