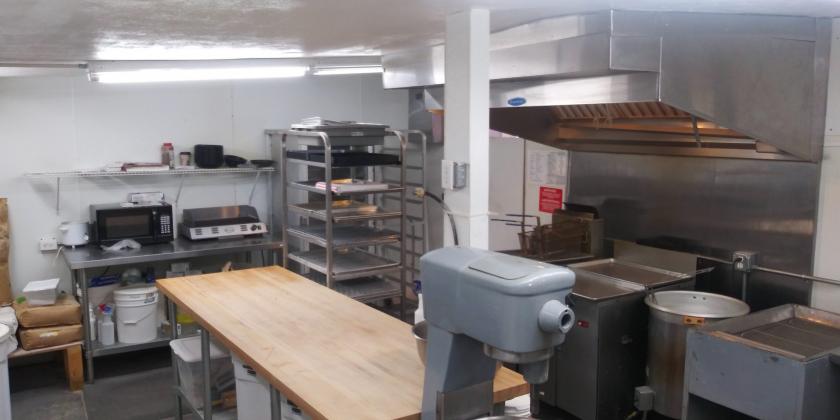
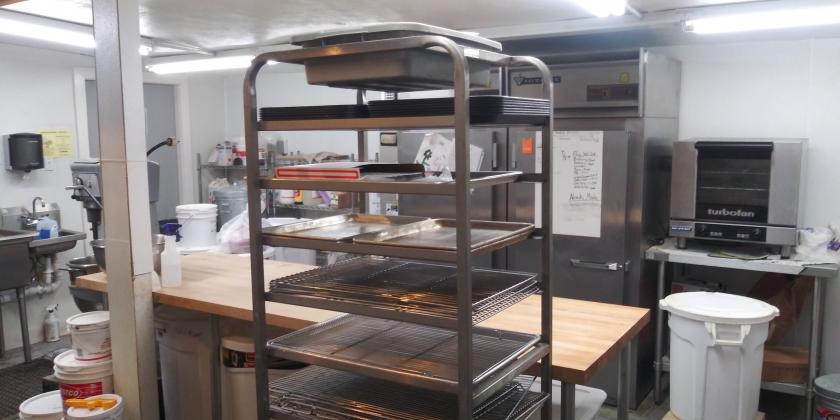
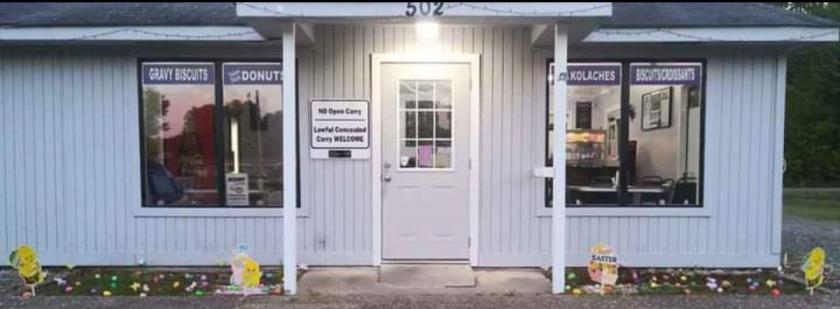
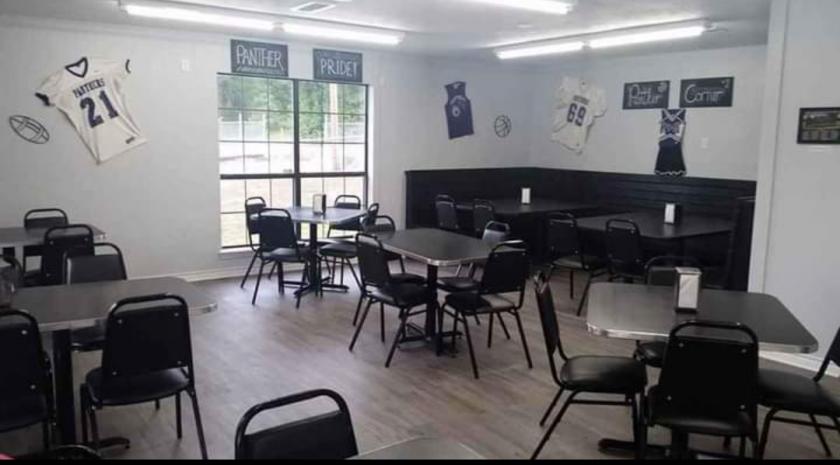
Retail Space
502 North Monster Expressway Fouke, AR 71837
502 North Monster Expressway Fouke, AR 71837
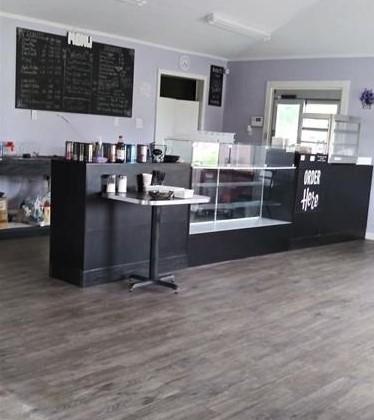
Details & Description
Additional Photos


Listing Agents

Lacy Coker
M: 903-748-7575
coker_lacy19@yahoo.com
M: 903-748-7575
coker_lacy19@yahoo.com
While we strive to provide the most accurate information, all listing information, and demographic data, is provided by third-parties. As such, MyEListing will not be responsible for the accuracy of the information. It is strongly recommended that you verify all information with the listing agent, and any relevant agencies, prior to making any decisions.