Description
LevRose Commercial Real Estate, as Exclusive Agent to the Seller, is pleased to present to qualified investors and medical
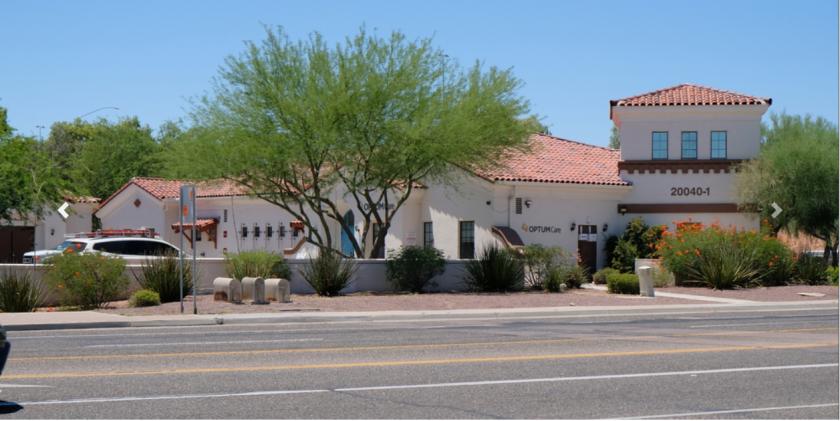
professionals, the opportunity to acquire fee simple interest in the multi-tenant office complex at 20040 N 19th Ave
in Phoenix, AZ. Situated directly off Loop 101, the site provides tremendous access and visibility along the freeway and is
located in close proximity to both the I-17 and SR-51.
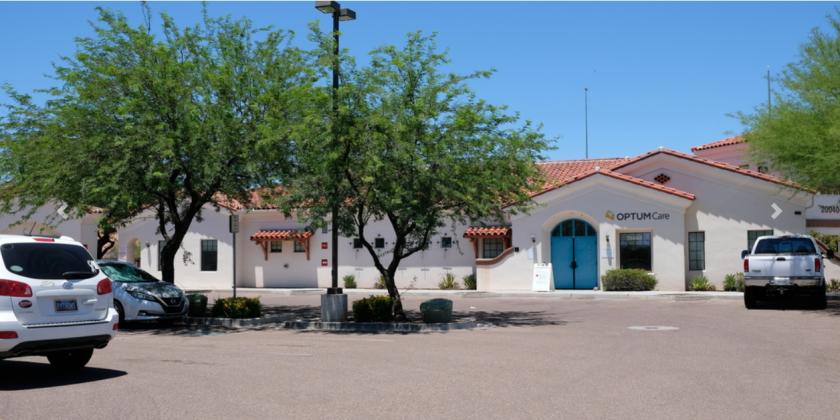
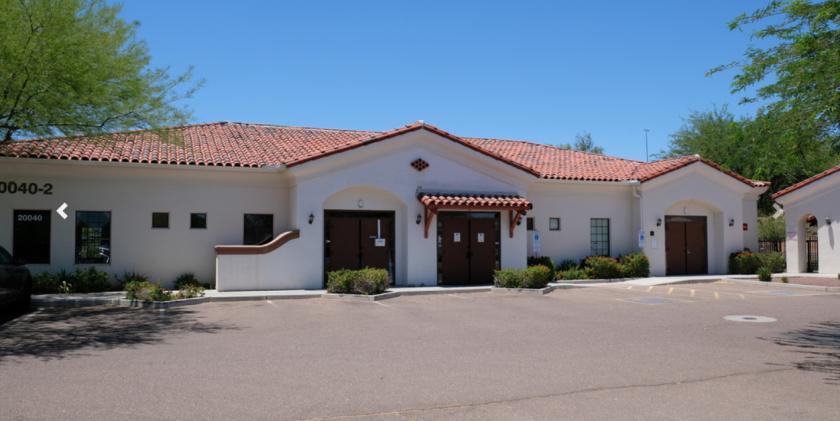
The property is approximately ±10,169 SF and is comprised of two buildings. Building A (±5,267 SF) is currently occupied by Optum, a subsidiary of UnitedHealth Group and known as the company’s technology-focused arm and health services department. Optum currently operates an internal medicine practice and has just completed a full renovation of the space (June 2020). Building B (±4,902 SF) is partially leased to Optum with the remaining space vacant and available (±3,513 SF). The vacant space is partially shell (±1,400 SF) and partially built out for a medical tenant (±2,113 SF). The building provides an array of options for adding value as an investment and/or a new home for day-to-day business operations. The site is zoned C-2 zoning allowing for a wide variety of uses.
Highlights
Owner/User opportunity with income
Tenant just completed renovation of their suite (June 2020)
Investment Tenant is an A+++ National Leading Health Care Provider
Potential value-added through lease up of current vacancy
Located directly off the Loop 101 freeway
No part of this information may be copied, reproduced, repurposed, or screen-captured for any commercial purpose without prior written authorization from MyEListing.
While we strive to provide the most accurate information, all listing information, and demographic data, is provided by third-parties. As such, MyEListing will not be responsible for the accuracy of the information. It is strongly recommended that you verify all information with the listing agent, and any relevant agencies, prior to making any decisions.
What is the asking price for 20040 North 19th Avenue in Phoenix?
The asking price for 20040 North 19th Avenue is $2,499,000
What is the building size of this Office property in Phoenix, AZ?
The size of the building/unit at 20040 North 19th Avenue in Phoenix is 10,169 square feet
How much land does the Phoenix, AZ property at 20040 North 19th Avenue include?
20040 North 19th Avenue in Phoenix includes 0.588 acres of land
What kind of Office is the propery at 20040 North 19th Avenue?
The property at 20040 North 19th Avenue Phoenix, AZ 85027 is listed as a Medical Office property
What is the population within 1 mile of 20040 North 19th Avenue in Phoenix?
The population within 1 mile of 20040 North 19th Avenue Phoenix, AZ 85027 is 14,082 people.
Who do I contact for questions about 20040 North 19th Avenue?
You should contact the listing agent,
Michael Waxman, for any details regarding this commercial listing.