Industrial Properties
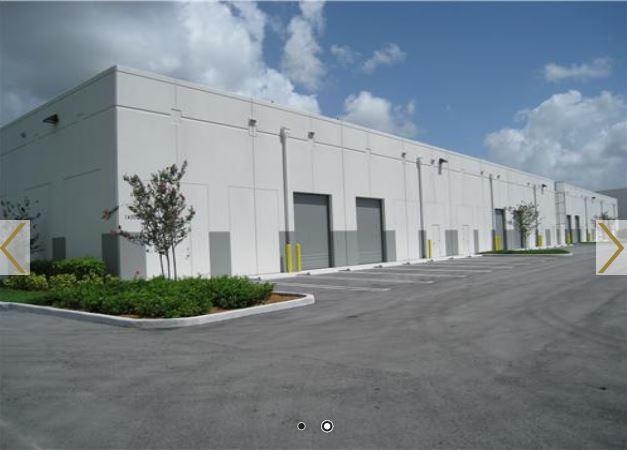
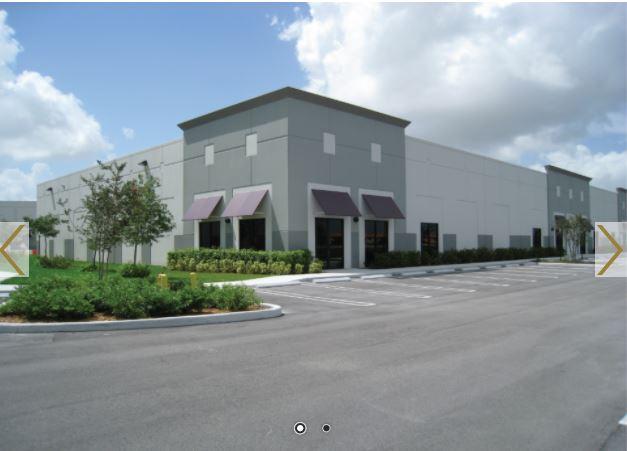
14458 Commerce Way Miami Lakes, FL 33016
14458 Commerce Way Miami Lakes, FL 33016
Details & Description
Listing Agents

Rene Vivo
O: 305-817-8899
M: 305-785-4905
Rvivo@vivogroup.net
O: 305-817-8899
M: 305-785-4905
Rvivo@vivogroup.net

Raydel Enriquez
O: 305-817-8899
Renriquez@vivogroup.net
O: 305-817-8899
Renriquez@vivogroup.net
While we strive to provide the most accurate information, all listing information, and demographic data, is provided by third-parties. As such, MyEListing will not be responsible for the accuracy of the information. It is strongly recommended that you verify all information with the listing agent, and any relevant agencies, prior to making any decisions.