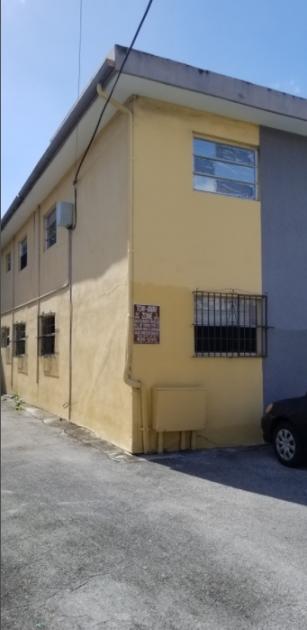
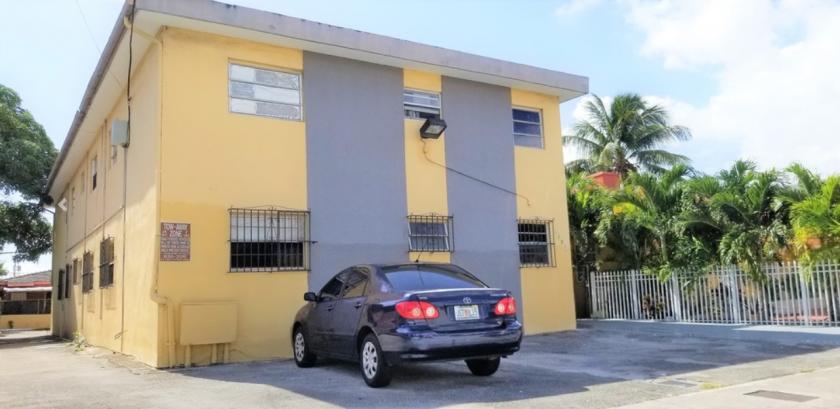
1-Mile | 3-Miles | 5-Miles | ||
---|---|---|---|---|
Total Population | 62,378 | 322,690 | 524,981 | |
Population Median Age | 41 | 41 | 41 | |
Population by Age | 0-9 Yrs | 6920 (11%) | 31456 (9%) | 54475 (10%) |
10-19 Yrs | 6001 (9%) | 27075 (8%) | 49742 (9%) | |
20-29 Yrs | 7849 (12%) | 45888 (14%) | 73504 (14%) | |
30-39 Yrs | 9868 (15%) | 53998 (16%) | 81810 (15%) | |
40-49 Yrs | 8745 (14%) | 47983 (14%) | 76635 (14%) | |
50-59 Yrs | 8306 (13%) | 42934 (13%) | 70396 (13%) | |
60-69 Yrs | 5877 (9%) | 33384 (10%) | 54621 (10%) | |
70+ Yrs | 8811 (14%) | 39972 (12%) | 63798 (12%) | |
Median HH Income | $26,957 | $38,474 | $40,329 | |
Total Household Income | < 24K | 10326 (46%) | 44703 (35%) | 66217 (34%) |
25-49K | 6498 (29%) | 29853 (23%) | 45420 (23%) | |
50-74K | 2567 (11%) | 17550 (13%) | 27480 (14%) | |
75-99K | 1243 (5%) | 10751 (8%) | 16591 (8%) | |
100-199K | 1044 (4%) | 15399 (12%) | 24877 (12%) | |
200K+ | 349 (1%) | 7306 (5%) | 12680 (6%) | |
Highest Education Level | No Diploma | 14477 | 54637 | 83791 |
Diploma or GED | 17243 | 69798 | 110085 | |
Some College | 5214 | 29425 | 49815 | |
Assoc. Degree | 2226 | 15455 | 27411 | |
Bachelors Degree | 4589 | 44258 | 68549 | |
Higher Degree | 1900 | 30864 | 48791 | |
Total Housing Units | 24,101 | 150,923 | 228,448 | |
--Owner-Occupied | 4,252 | 35,679 | 66,258 | |
--Renter-Occupied | 17,775 | 89,883 | 127,006 | |
Owner-Occupied Values | < 100K | 304 | 2429 | 5485 |
100-199K | 746 | 5606 | 11345 | |
200-299K | 997 | 8217 | 14147 | |
300-399K | 893 | 6322 | 10807 | |
400-499K | 744 | 4198 | 6408 | |
500K+ | 568 | 8906 | 18066 | |
Total Working Age Population | 52,189 | 274,771 | 441,339 | |
In Work Force | 31,011 | 171,133 | 271,410 | |
Not In Work Force | 21,178 | 103,638 | 169,929 | |
Workforce Employed | 28,720 | 161,357 | 253,262 | |
Workforce Unemployed | 2,291 | 9,631 | 17,933 | |
Civlian Workforce | 31,011 | 170,988 | 271,194 | |
Military Workforce | 0 | 145 | 216 | |
Total Households | 22,027 | 125,562 | 193,265 | |
Family Households | 13,797 | 67,669 | 109,533 | |
Non-Family Households | 8,230 | 57,893 | 83,732 | |
Married Couple | 7,618 | 41,697 | 65,797 | |
Other Family | 6,179 | 25,972 | 43,736 | |
Married w/Child | 3,401 | 15,258 | 24,326 | |
Single Male w/Child | 747 | 2,423 | 3,666 | |
Single Female w/Child | 1,691 | 8,233 | 14,465 |
Population Change Last Two Decades - Plus Projection
2000 | % | 2010 | % | 2020 | % | 2030 | |
---|---|---|---|---|---|---|---|
Florida | 15,982,378 | +18 | 18,801,310 | +14 | 21,517,610 | +13 | 24,340,457 |
Miami-Dade County | 2,253,362 | +11 | 2,496,435 | +15 | 2,861,579 | +11 | 3,190,242 |
Total Working Age Population:
Total Households:
Total Working Age Population:
Total Households:
Total Working Age Population:
Total Households: