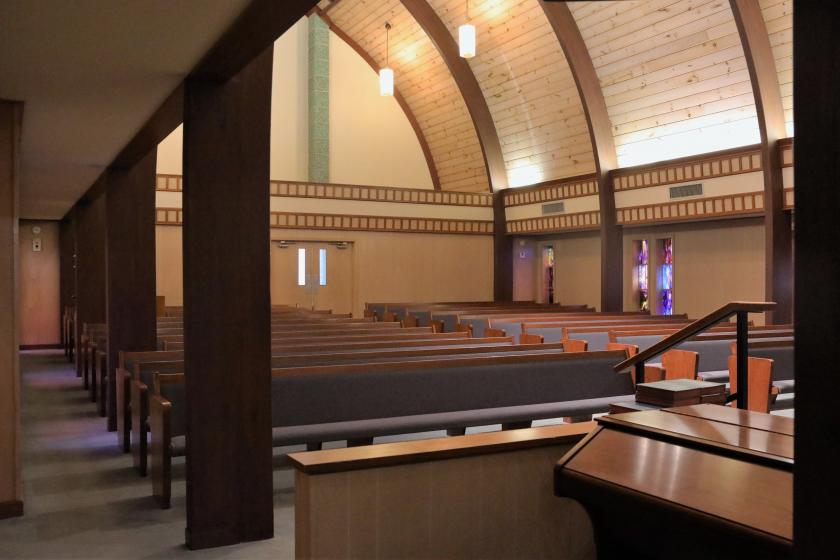
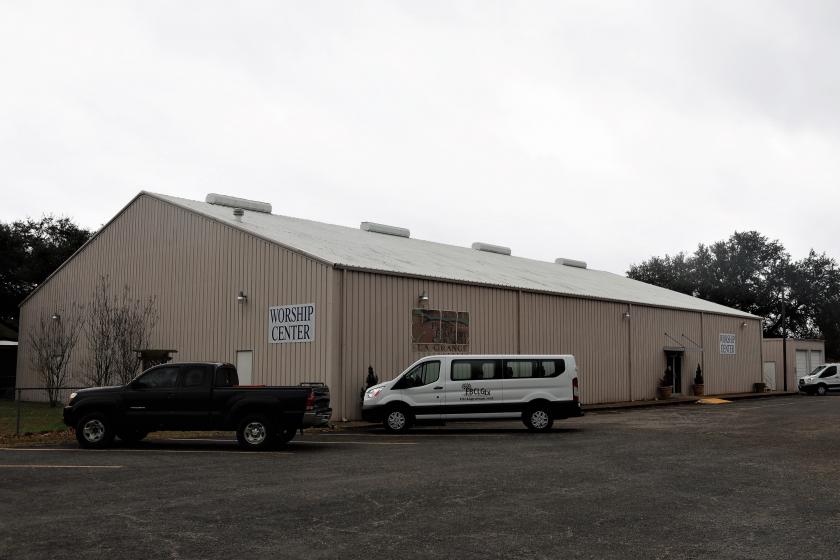
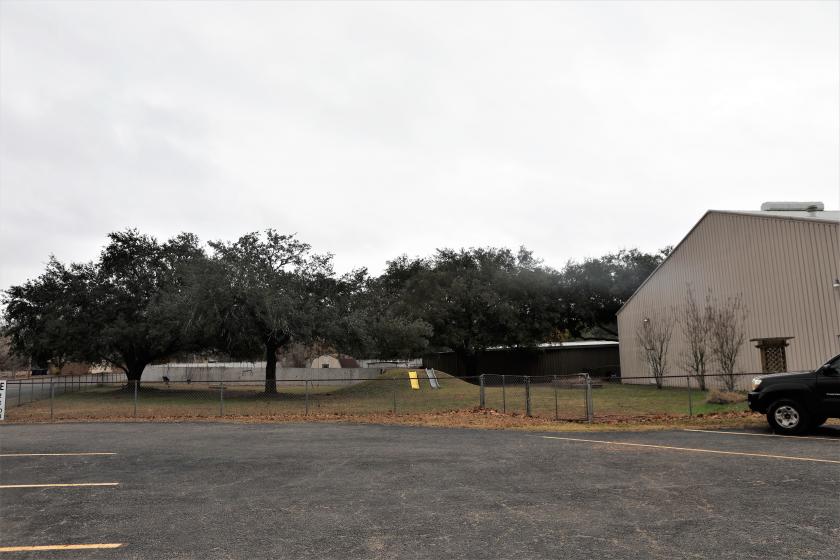
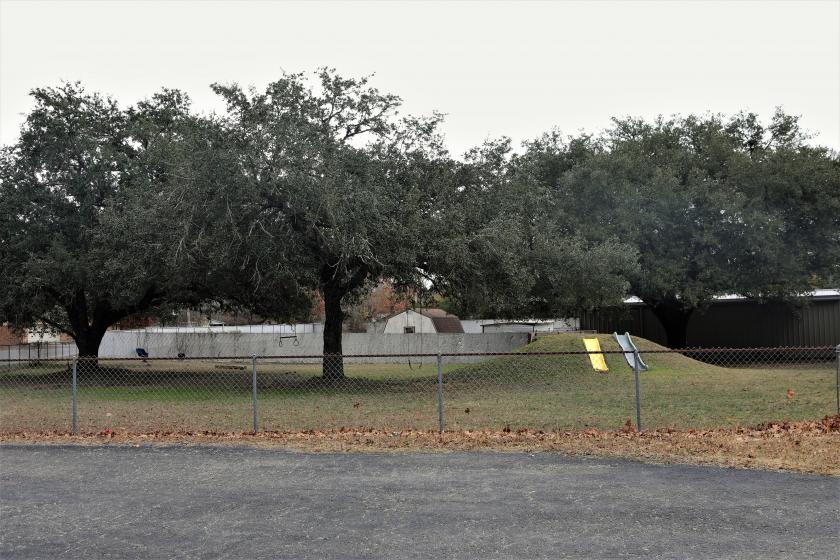
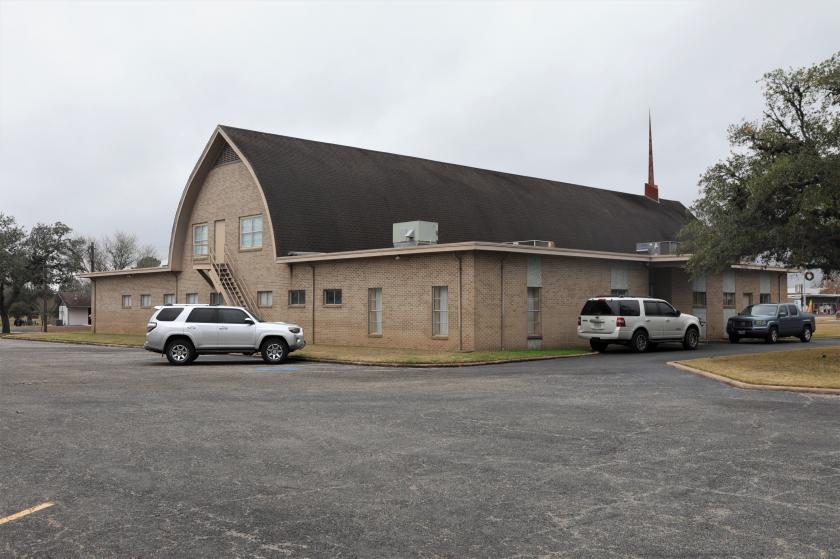
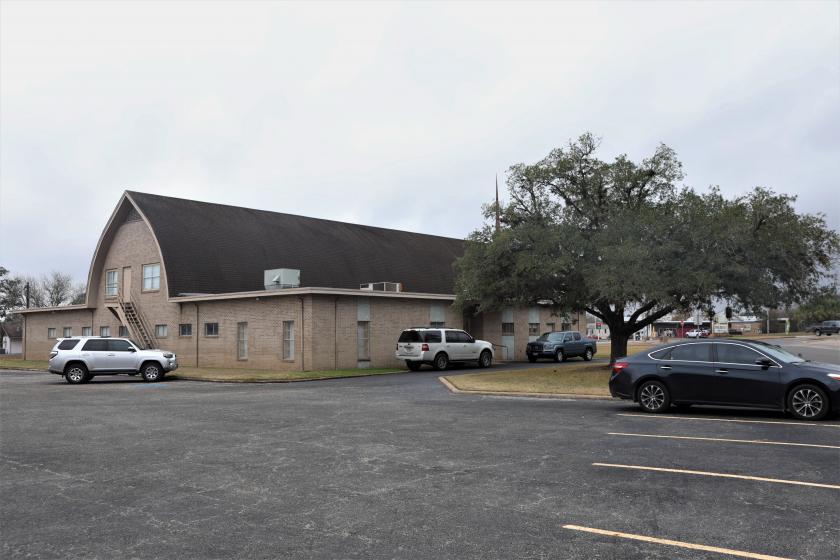
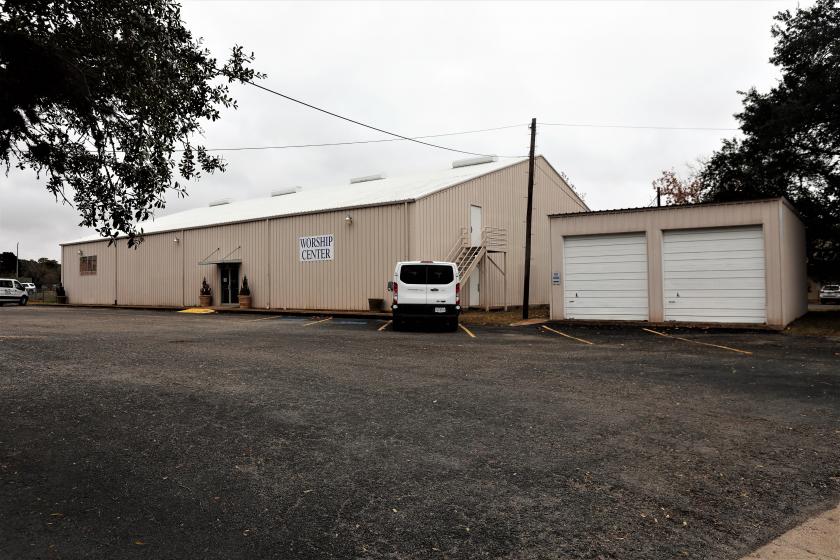
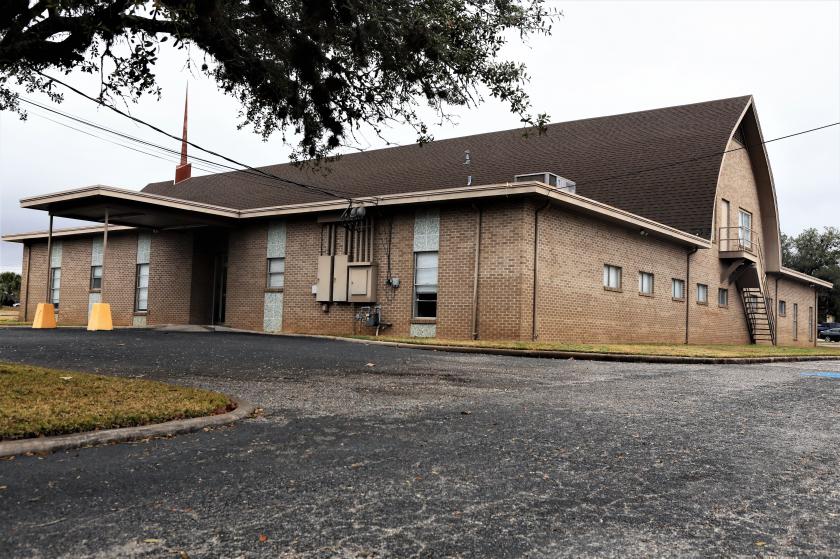
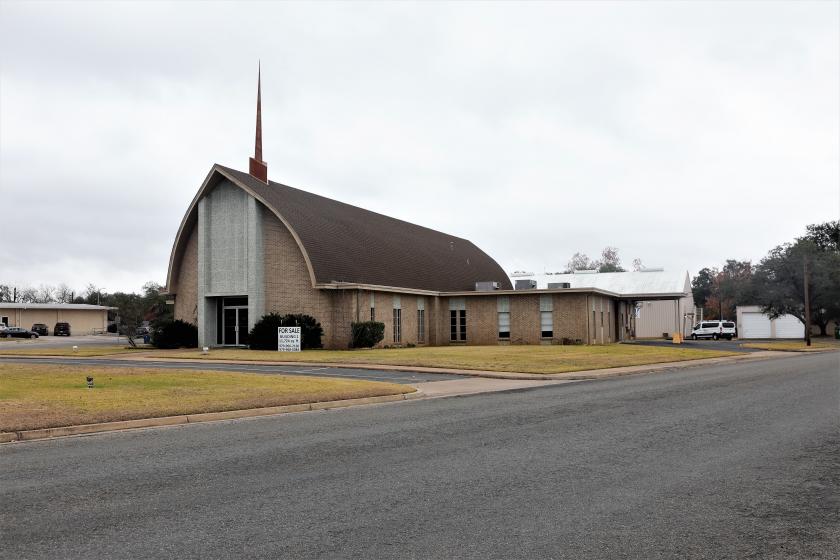
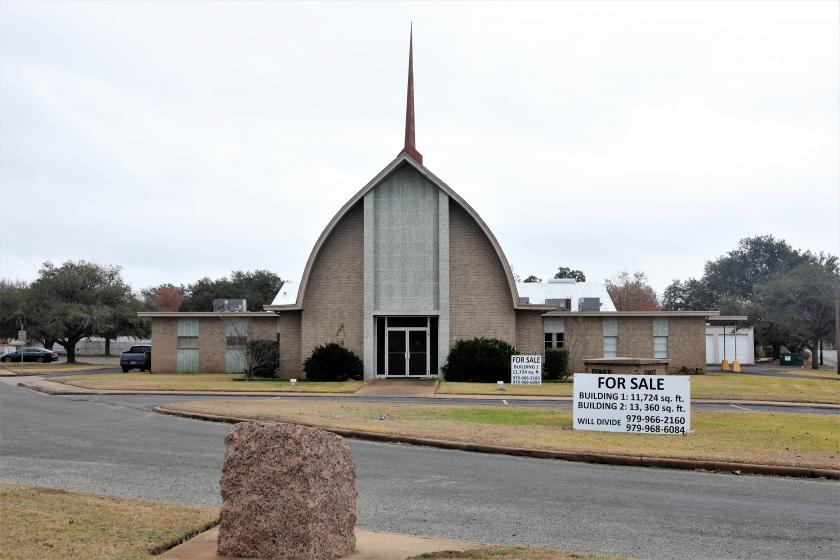
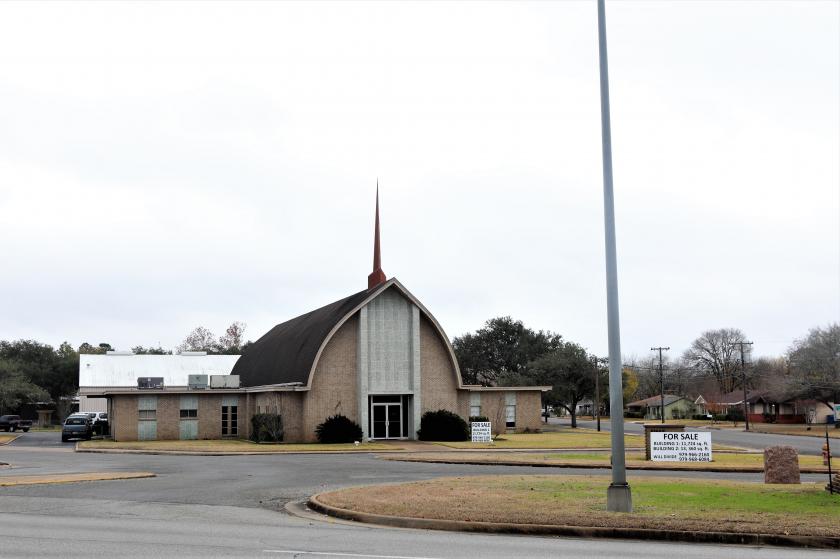
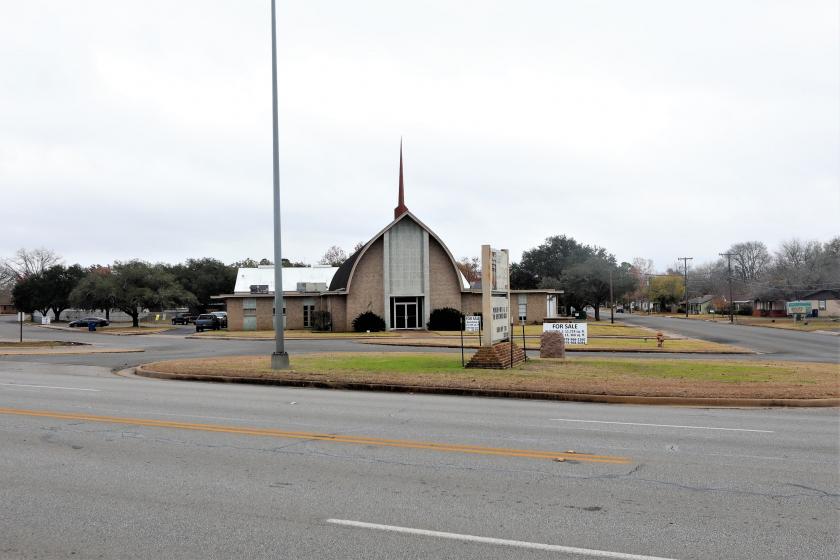
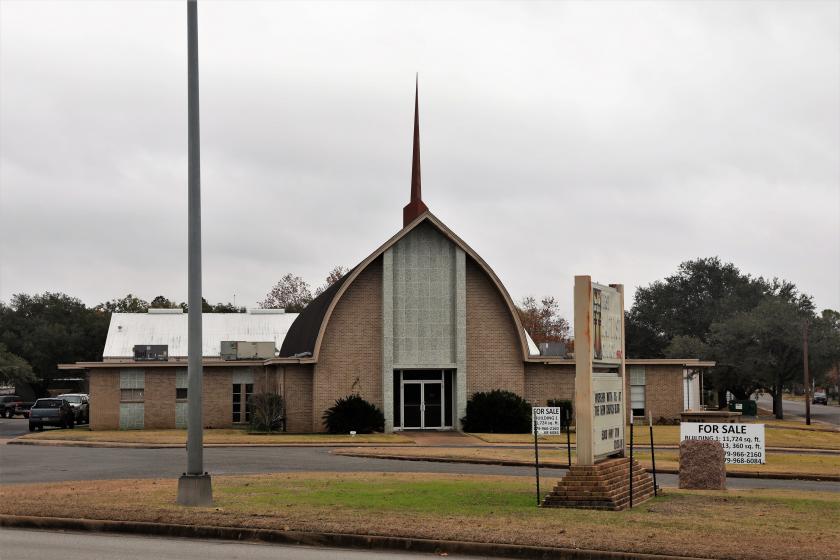
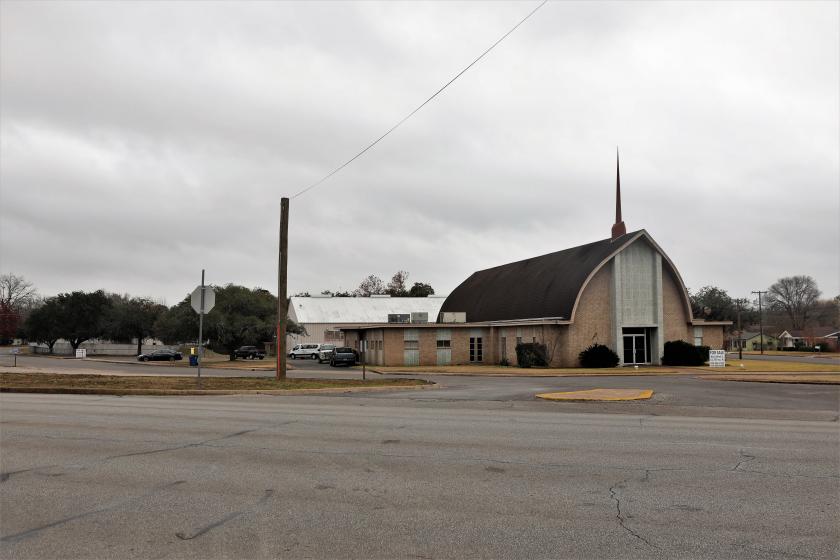
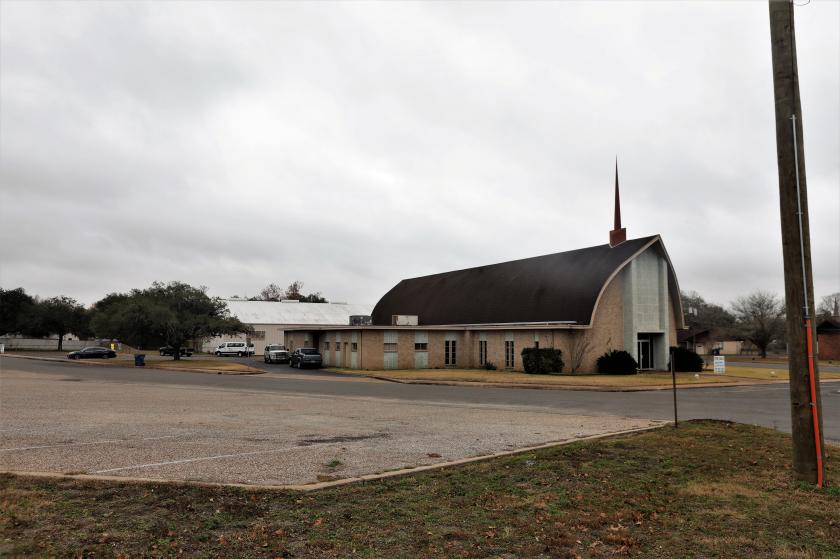
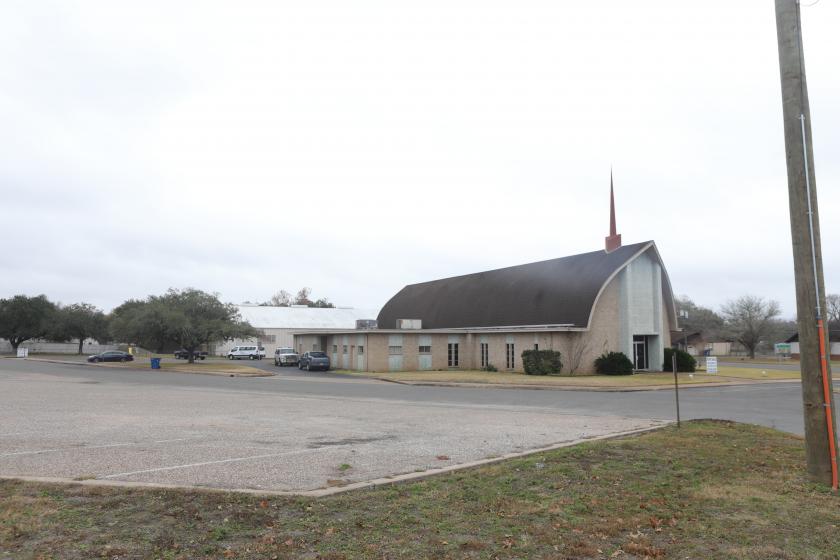
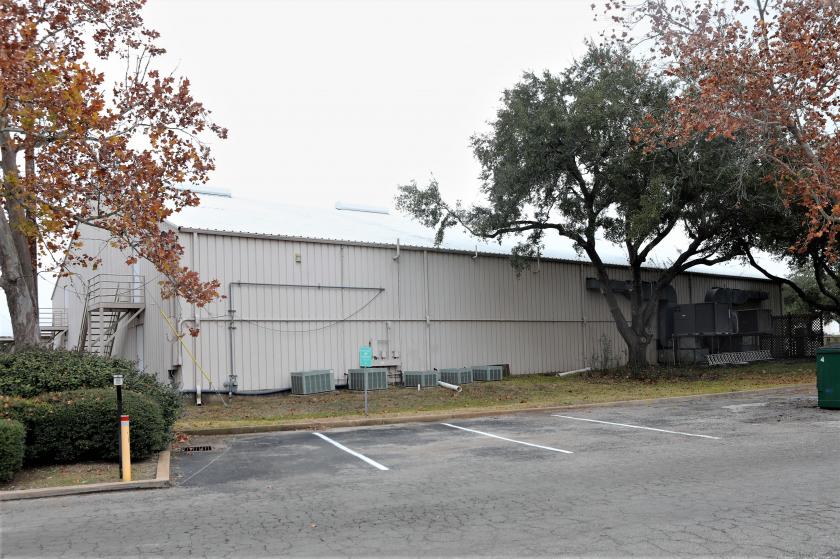
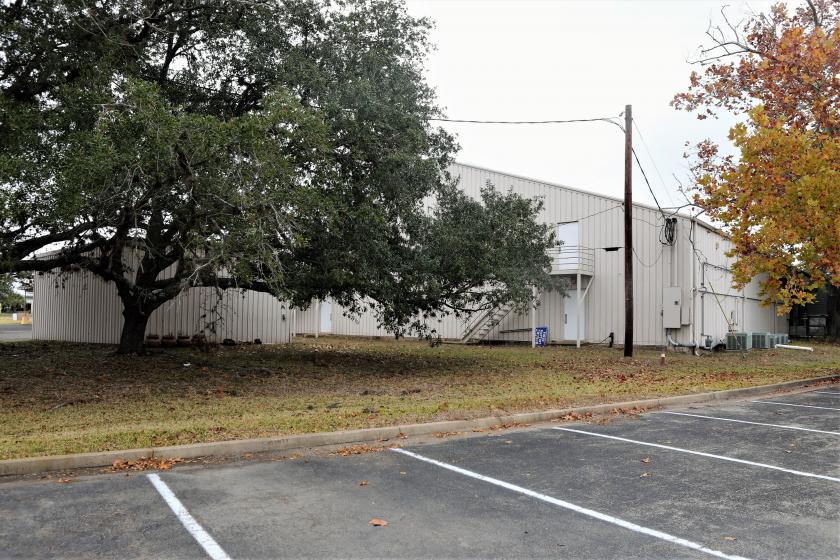
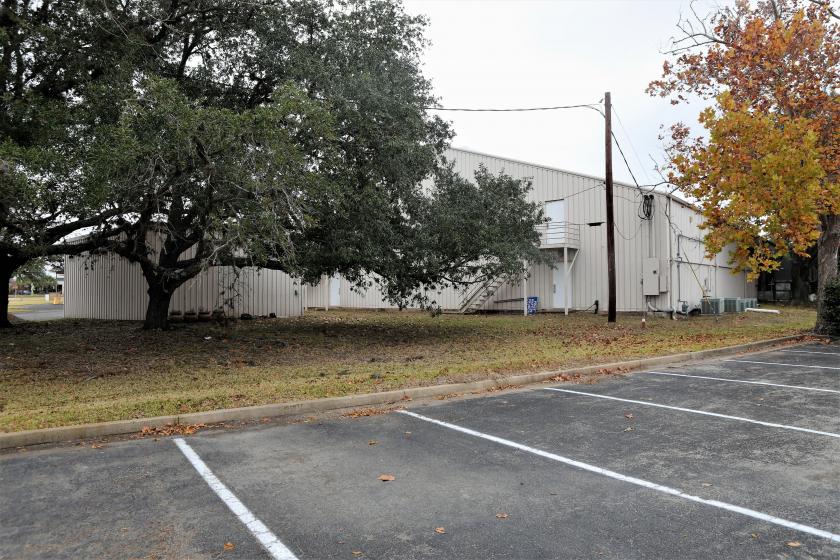
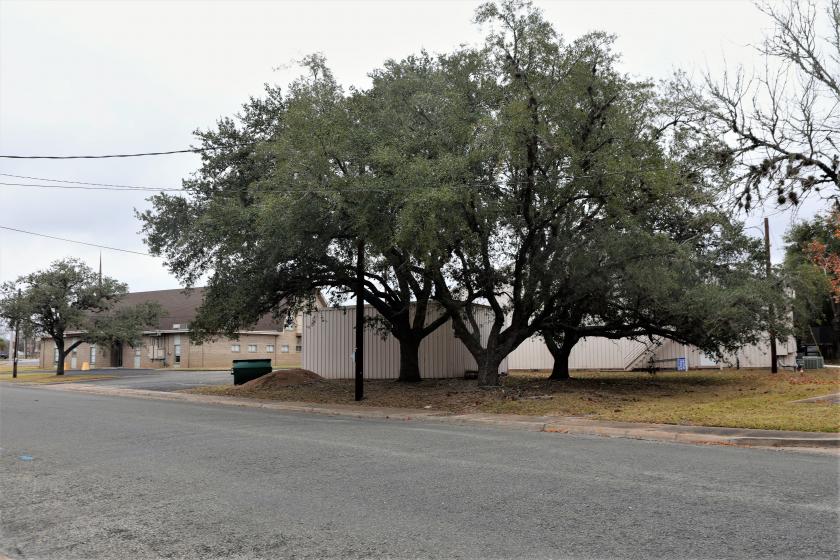
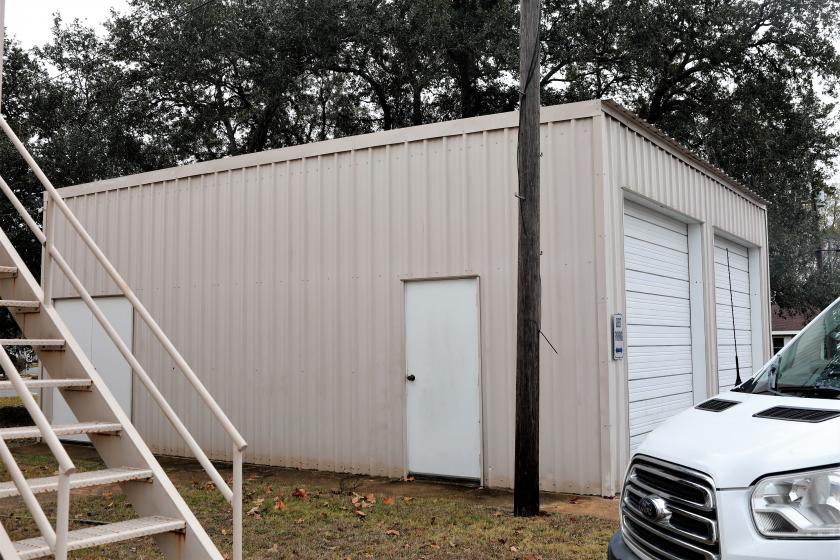
2 Buildings onsite plus a metal storage buildingBuilding 1: 11, 724 sq. ft. with asking price of $350,000.00Building 2: 13, 360 sq. ft. with asking price of $550,000.00High visibility on frontage of Business 71 in La GrangeCurrent Assessment Value: $1,263,590.00Please call 979-966-2160 or 979-968-6084 for more information or questionsThis is commercial acreage within the city limits of La Grange. Centrally located between Austin, Houston and San Antonio in the heart of Fayette County. This property is currently the offices of First Baptist Church and has several multipurpose buildings with high visibility on Business 71. The subject's improvements could be repurposed for additional uses including commercial office or warehouse space, recreation center, visitor's center, day care or private school. La Grange is the county seat in Fayette County with a population of approximately 4,677 (per Census Bureau) within the city limits and approximately 25,436 (per The Census Bureau) in the county."La Grange, Texas is centrally located providing ready access to the major metropolitan areas of Houston, San Antonio and Austin. Being the largest City in the County and the County seat, La Grange is the center of commerce for Fayette County. Boasting a vibrant Downtown Business District, La Grange's role as a regional hub or center continues today. The labor force drawing area of the City consists of a 65 mile radius. The economy is primarily driven by Agriculture, Tourism, Material Excavation, Oil/Gas Exploration and Public Power Generation Industries. The history, natural beauty, quality of life and various attractions in the region combine to make the La Grange area an ideal place to do business, while attracting visitors and tourism, second homes and retirement homes. La Grange enjoys a rural lifestyle while in close proximity to all the modern amenities of the urban cities nearby. La Grange is approximately one hour driving distance to downtown Austin and one hour and twenty five minutes to downtown Houston. La Grange, Texas is a great place to grow a family, a business or retire!" (Read more at http://www.cityoflg.com/business/demographics/index.php#OUY3doTmE8FX0K4a.99).