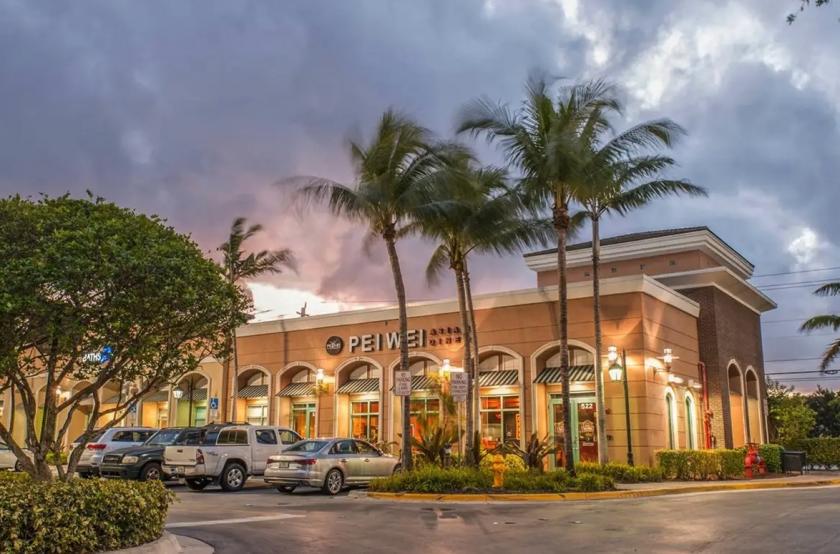
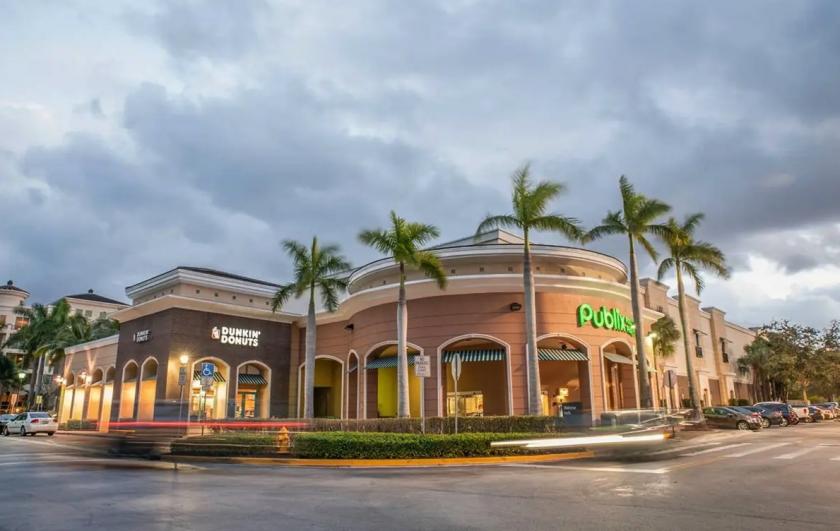
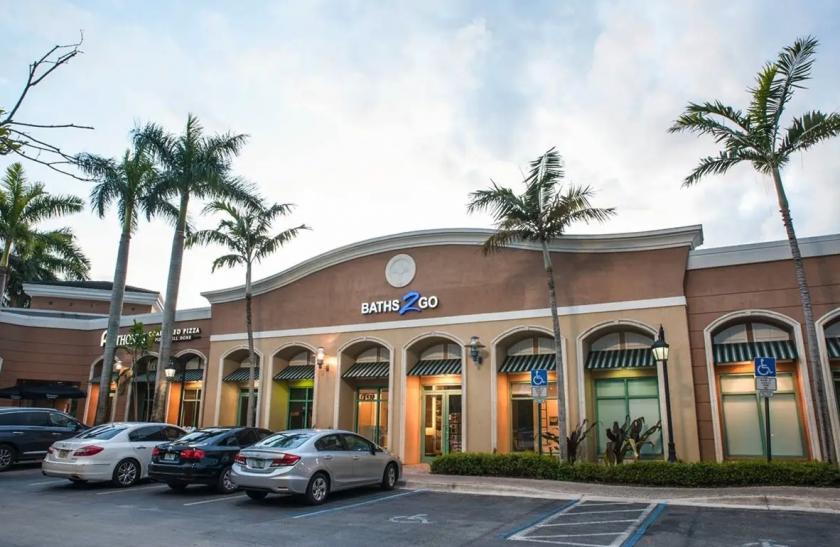
1-Mile | 3-Miles | 5-Miles | ||
---|---|---|---|---|
Total Population | 19,346 | 150,765 | 389,286 | |
Population Median Age | 40 | 40 | 38 | |
Population by Age | 0-9 Yrs | 2344 (12%) | 17308 (11%) | 48910 (12%) |
10-19 Yrs | 1492 (7%) | 16512 (10%) | 47834 (12%) | |
20-29 Yrs | 3094 (15%) | 20951 (13%) | 56208 (14%) | |
30-39 Yrs | 3193 (16%) | 21176 (14%) | 53723 (13%) | |
40-49 Yrs | 2231 (11%) | 17936 (11%) | 48339 (12%) | |
50-59 Yrs | 2550 (13%) | 20662 (13%) | 53140 (13%) | |
60-69 Yrs | 2152 (11%) | 18883 (12%) | 43145 (11%) | |
70+ Yrs | 2291 (11%) | 17339 (11%) | 37986 (9%) | |
Median HH Income | $68,536 | $59,043 | $54,359 | |
Total Household Income | < 24K | 1146 (15%) | 11300 (20%) | 29758 (22%) |
25-49K | 1395 (18%) | 12739 (23%) | 32085 (24%) | |
50-74K | 1694 (22%) | 9643 (17%) | 24184 (18%) | |
75-99K | 1281 (16%) | 7208 (13%) | 16260 (12%) | |
100-199K | 1765 (23%) | 11480 (20%) | 24652 (18%) | |
200K+ | 326 (4%) | 2933 (5%) | 5955 (4%) | |
Highest Education Level | No Diploma | 652 | 10235 | 32391 |
Diploma or GED | 2925 | 26420 | 74987 | |
Some College | 2756 | 21380 | 51965 | |
Assoc. Degree | 1869 | 11467 | 27167 | |
Bachelors Degree | 3656 | 23804 | 51330 | |
Higher Degree | 2465 | 14900 | 28838 | |
Total Housing Units | 8,779 | 63,699 | 153,809 | |
--Owner-Occupied | 3,212 | 36,670 | 82,371 | |
--Renter-Occupied | 4,395 | 18,632 | 50,522 | |
Owner-Occupied Values | < 100K | 379 | 9081 | 20084 |
100-199K | 945 | 8952 | 20866 | |
200-299K | 901 | 6800 | 17496 | |
300-399K | 501 | 5480 | 11888 | |
400-499K | 317 | 3634 | 6167 | |
500K+ | 169 | 2723 | 5870 | |
Total Working Age Population | 16,017 | 123,556 | 311,678 | |
In Work Force | 11,395 | 80,600 | 205,101 | |
Not In Work Force | 4,623 | 42,956 | 106,577 | |
Workforce Employed | 10,807 | 75,577 | 190,729 | |
Workforce Unemployed | 588 | 5,008 | 14,260 | |
Civlian Workforce | 11,395 | 80,584 | 204,988 | |
Military Workforce | 0 | 16 | 113 | |
Total Households | 7,607 | 55,302 | 132,893 | |
Family Households | 4,713 | 35,314 | 88,141 | |
Non-Family Households | 2,894 | 19,988 | 44,752 | |
Married Couple | 3,218 | 23,528 | 55,672 | |
Other Family | 1,496 | 11,785 | 32,469 | |
Married w/Child | 1,084 | 8,200 | 21,483 | |
Single Male w/Child | 220 | 1,250 | 3,008 | |
Single Female w/Child | 573 | 4,425 | 12,222 |
Population Change Last Two Decades - Plus Projection
2000 | % | 2010 | % | 2020 | % | 2030 | |
---|---|---|---|---|---|---|---|
Florida | 15,982,378 | +18 | 18,801,310 | +14 | 21,517,610 | +13 | 24,340,457 |
Broward County | 1,623,018 | +8 | 1,748,066 | +11 | 1,942,686 | +9 | 2,120,334 |
Total Working Age Population:
Total Households:
Total Working Age Population:
Total Households:
Total Working Age Population:
Total Households: