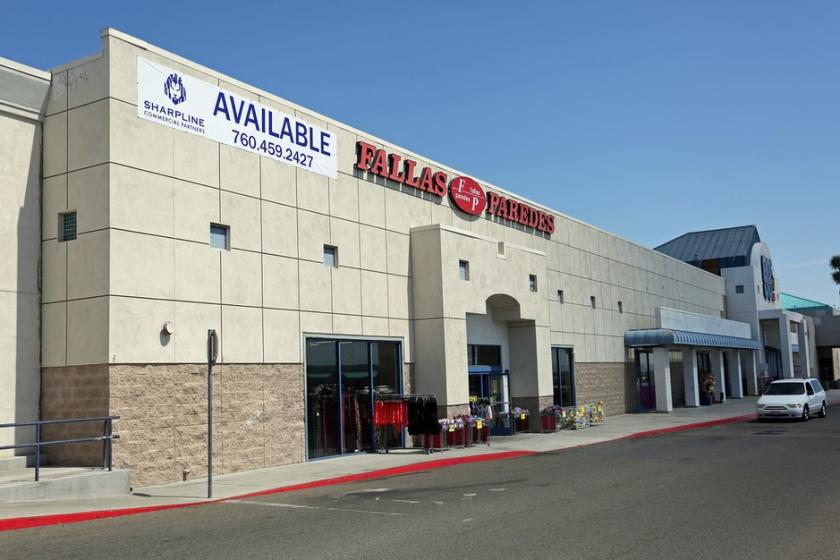
Retail Space
12480 Amargosa Road Victorville, CA 92392
12480 Amargosa Road Victorville, CA 92392

Details & Description
Property Highlights
- • Best density in trade area
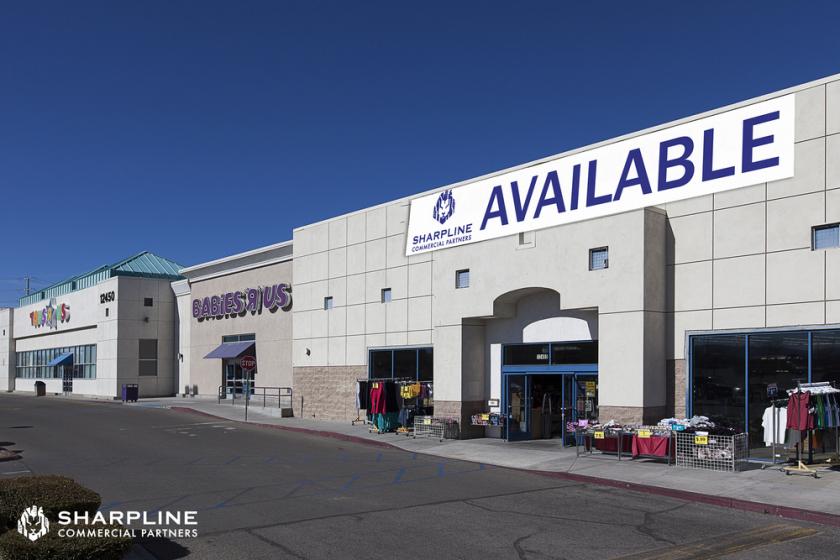
- • Ample surface parking
- • Great freeway visibility
- • Great daytime population
- • Close proximity to I-15 freeway
- • 18,600 SF available
Additional Photos

Listing Agents

Barbara Armendariz
O: 213-266-3333
contactus@sharplinecre.com
O: 213-266-3333
contactus@sharplinecre.com
While we strive to provide the most accurate information, all listing information, and demographic data, is provided by third-parties. As such, MyEListing will not be responsible for the accuracy of the information. It is strongly recommended that you verify all information with the listing agent, and any relevant agencies, prior to making any decisions.


