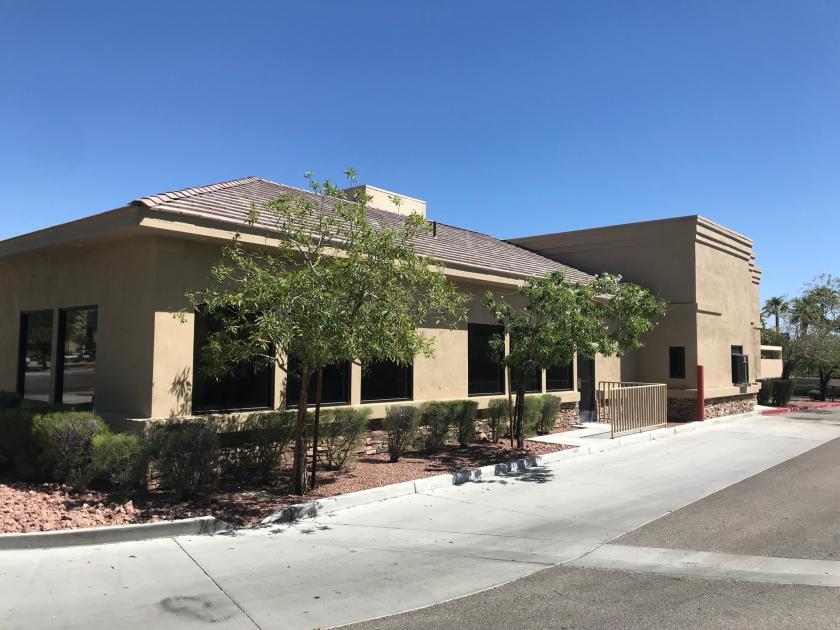
1-Mile | 3-Miles | 5-Miles | ||
---|---|---|---|---|
Total Population | 11,025 | 131,916 | 326,866 | |
Population Median Age | 43 | 44 | 40 | |
Population by Age | 0-9 Yrs | 991 (8%) | 12473 (9%) | 37093 (11%) |
10-19 Yrs | 1446 (13%) | 15506 (11%) | 39205 (11%) | |
20-29 Yrs | 855 (7%) | 12900 (9%) | 40006 (12%) | |
30-39 Yrs | 1119 (10%) | 15148 (11%) | 41344 (12%) | |
40-49 Yrs | 1836 (16%) | 19062 (14%) | 47248 (14%) | |
50-59 Yrs | 1888 (17%) | 18307 (13%) | 44610 (13%) | |
60-69 Yrs | 1530 (13%) | 17509 (13%) | 38374 (11%) | |
70+ Yrs | 1360 (12%) | 21011 (15%) | 38986 (11%) | |
Median HH Income | $85,397 | $68,381 | $62,700 | |
Total Household Income | < 24K | 318 (6%) | 8057 (14%) | 20950 (16%) |
25-49K | 905 (19%) | 11765 (21%) | 29478 (23%) | |
50-74K | 778 (17%) | 9772 (18%) | 23793 (18%) | |
75-99K | 654 (14%) | 7204 (13%) | 17620 (13%) | |
100-199K | 1249 (27%) | 12508 (23%) | 25417 (20%) | |
200K+ | 643 (14%) | 4861 (8%) | 9122 (7%) | |
Highest Education Level | No Diploma | 267 | 6635 | 22312 |
Diploma or GED | 1492 | 21193 | 58366 | |
Some College | 1763 | 24631 | 60626 | |
Assoc. Degree | 769 | 8376 | 19158 | |
Bachelors Degree | 2438 | 23299 | 45754 | |
Higher Degree | 1507 | 14416 | 26180 | |
Total Housing Units | 5,327 | 61,679 | 142,661 | |
--Owner-Occupied | 2,970 | 33,669 | 70,935 | |
--Renter-Occupied | 1,577 | 20,498 | 55,447 | |
Owner-Occupied Values | < 100K | 37 | 1521 | 4509 |
100-199K | 411 | 5990 | 15988 | |
200-299K | 780 | 10498 | 21805 | |
300-399K | 649 | 7520 | 13194 | |
400-499K | 180 | 2971 | 5721 | |
500K+ | 913 | 5169 | 9718 | |
Total Working Age Population | 9,121 | 109,362 | 264,652 | |
In Work Force | 5,778 | 65,290 | 168,514 | |
Not In Work Force | 3,343 | 44,072 | 96,138 | |
Workforce Employed | 5,429 | 60,773 | 156,823 | |
Workforce Unemployed | 349 | 4,321 | 11,247 | |
Civlian Workforce | 5,778 | 65,094 | 168,070 | |
Military Workforce | 0 | 196 | 444 | |
Total Households | 4,547 | 54,167 | 126,382 | |
Family Households | 3,093 | 33,520 | 79,035 | |
Non-Family Households | 1,454 | 20,647 | 47,347 | |
Married Couple | 2,482 | 24,438 | 54,917 | |
Other Family | 611 | 9,082 | 24,118 | |
Married w/Child | 827 | 7,964 | 19,509 | |
Single Male w/Child | 51 | 989 | 3,227 | |
Single Female w/Child | 286 | 3,117 | 8,453 |
Population Change Last Two Decades - Plus Projection
2000 | % | 2010 | % | 2020 | % | 2030 | |
---|---|---|---|---|---|---|---|
Nevada | 1,998,257 | +35 | 2,700,551 | +17 | 3,149,234 | +10 | 3,460,728 |
Clark County | 1,375,765 | +42 | 1,951,269 | +19 | 2,318,174 | +10 | 2,550,048 |
Total Working Age Population:
Total Households:
Total Working Age Population:
Total Households:
Total Working Age Population:
Total Households: