Industrial Properties
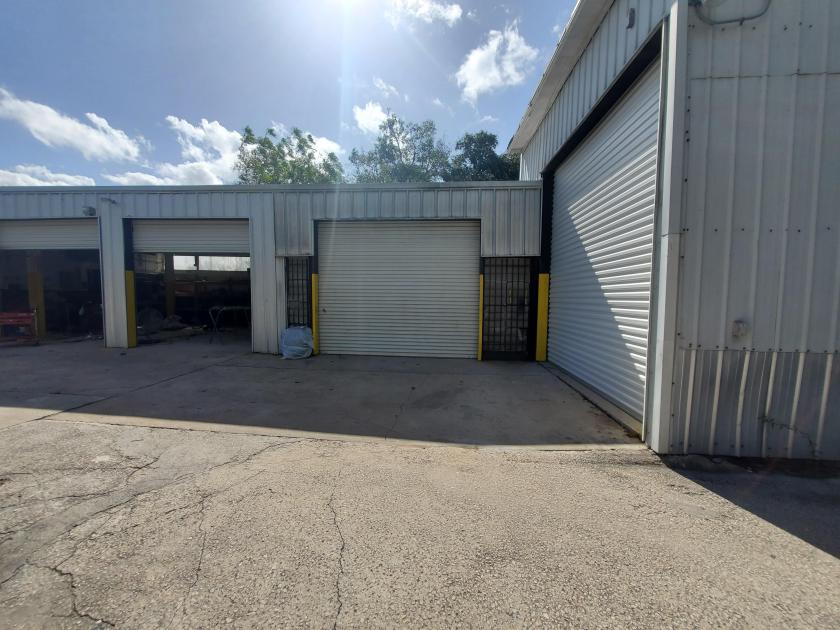
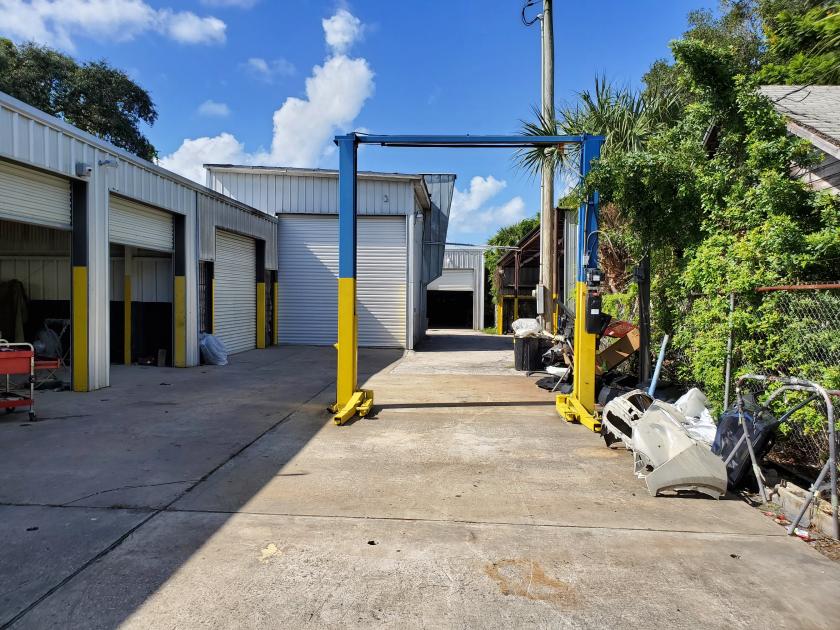
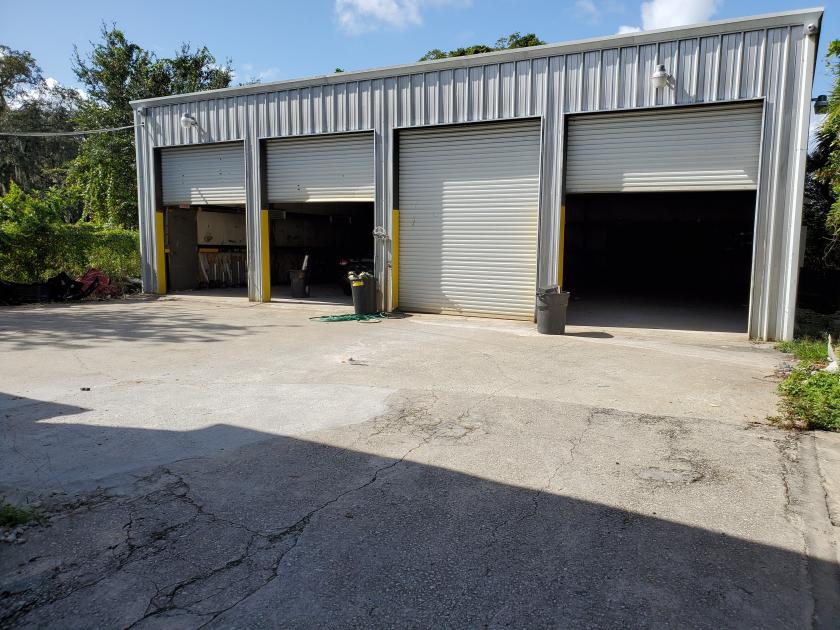
908 Maltby Avenue Orlando, FL 32803
908 Maltby Avenue Orlando, FL 32803

Details & Description
Additional Photos


Listing Agents

manny martin martin
manny57@ymail.com
manny57@ymail.com
While we strive to provide the most accurate information, all listing information, and demographic data, is provided by third-parties. As such, MyEListing will not be responsible for the accuracy of the information. It is strongly recommended that you verify all information with the listing agent, and any relevant agencies, prior to making any decisions.