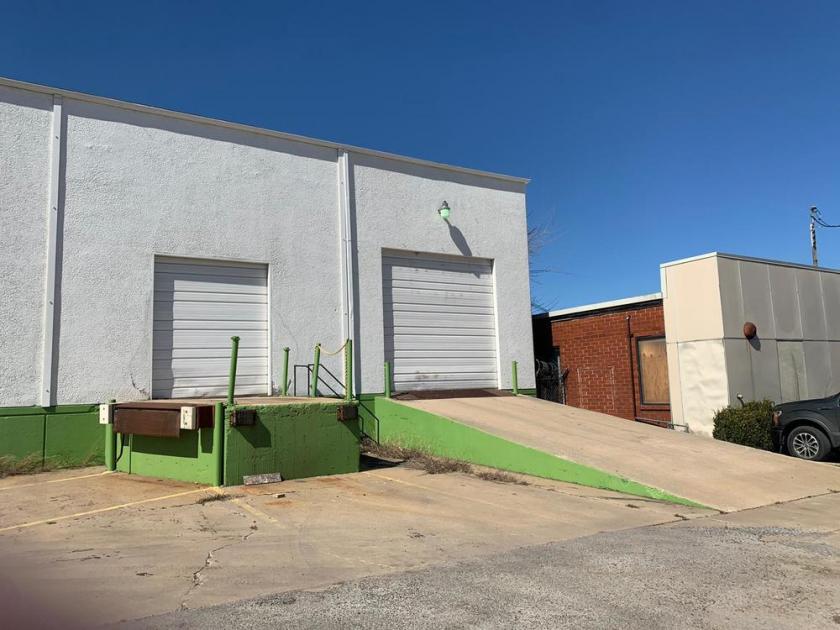
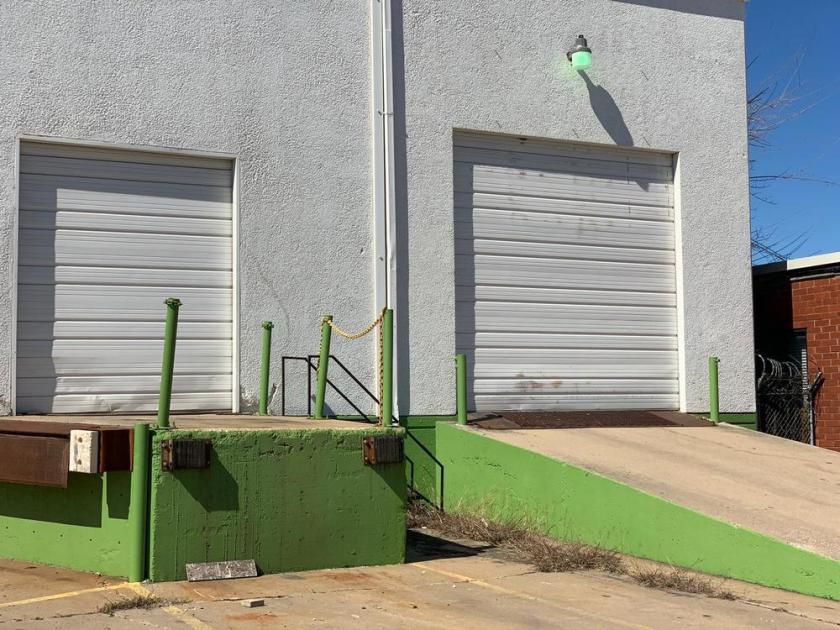
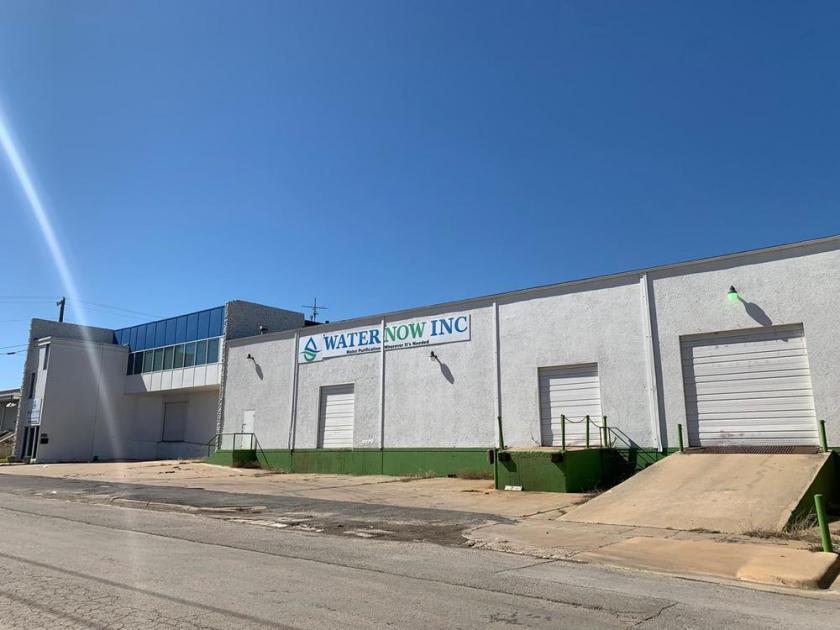
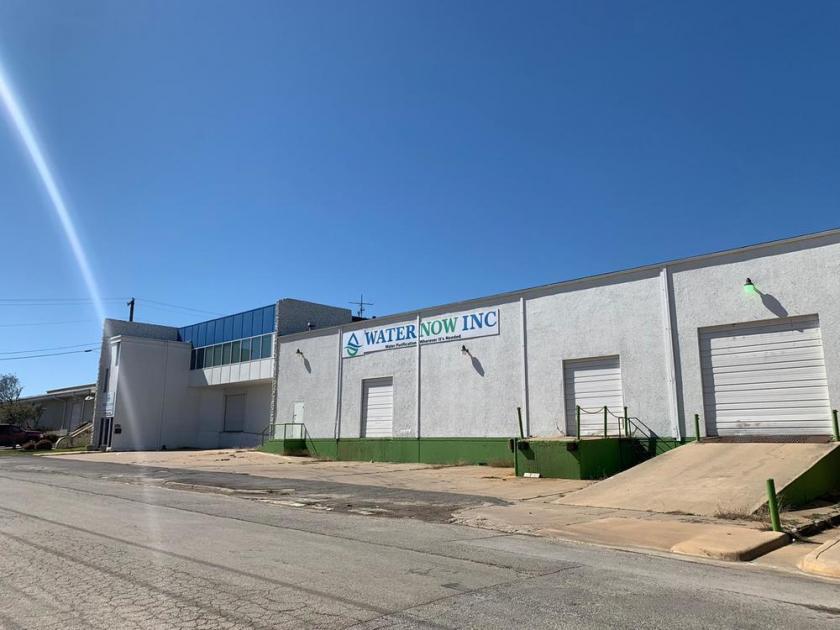
Industrial Properties
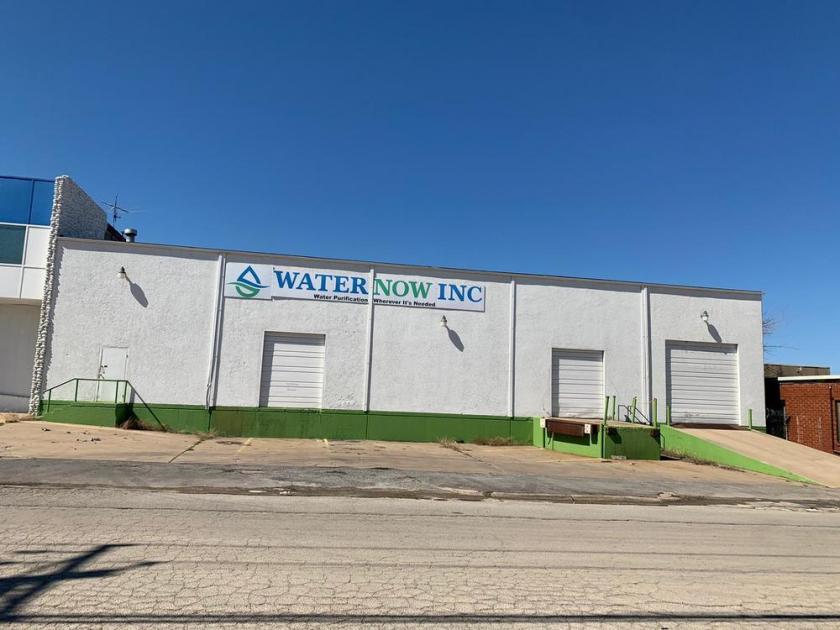
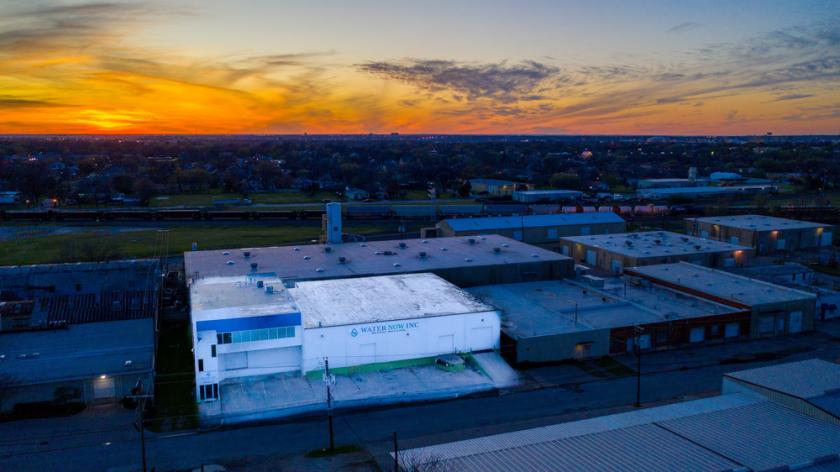
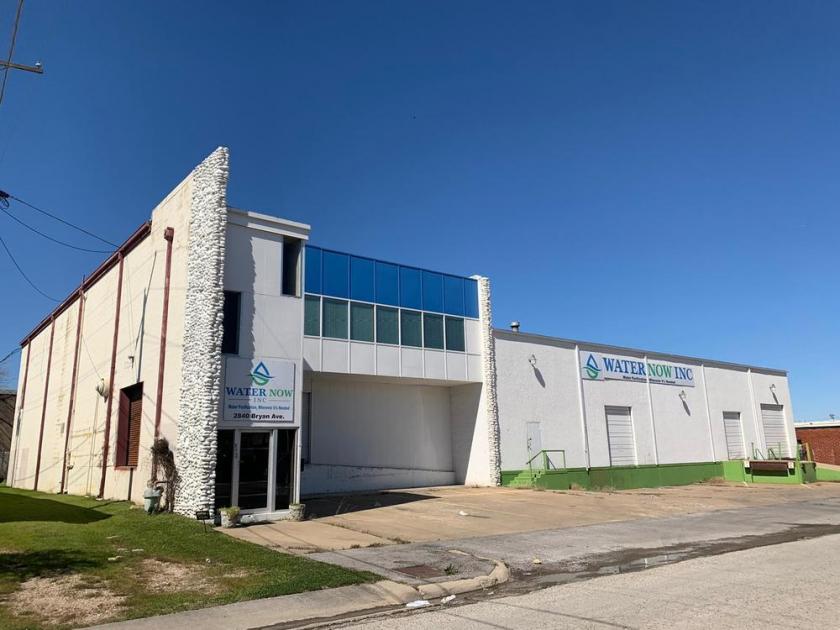
2840 Bryan Avenue Fort Worth, TX 76104
2840 Bryan Avenue Fort Worth, TX 76104
Details & Description
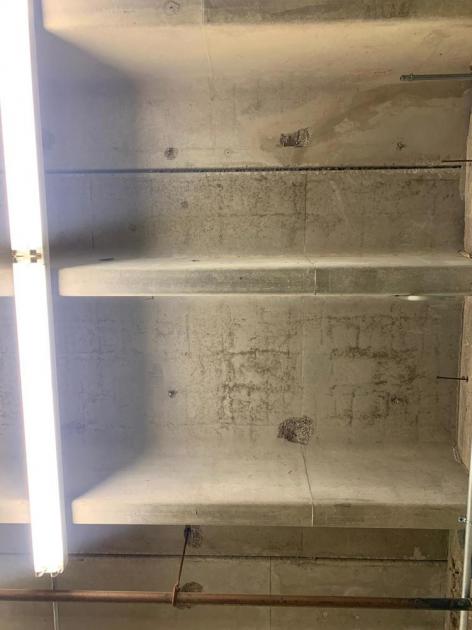
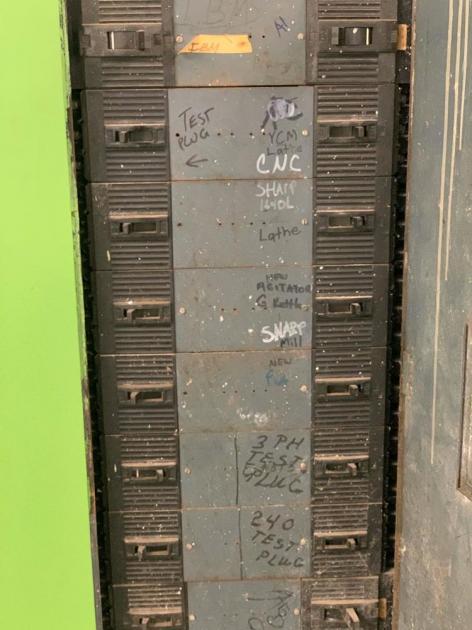
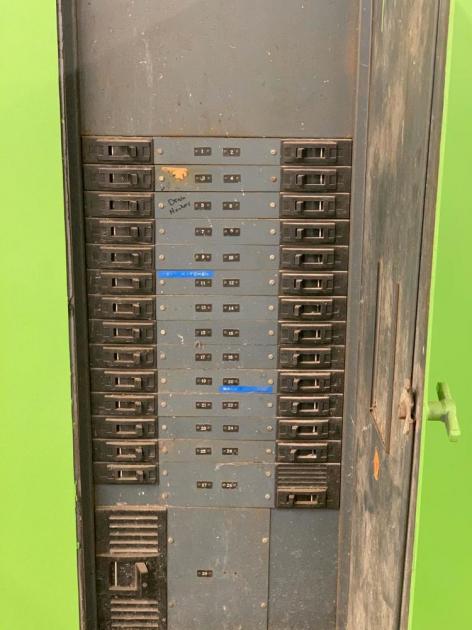
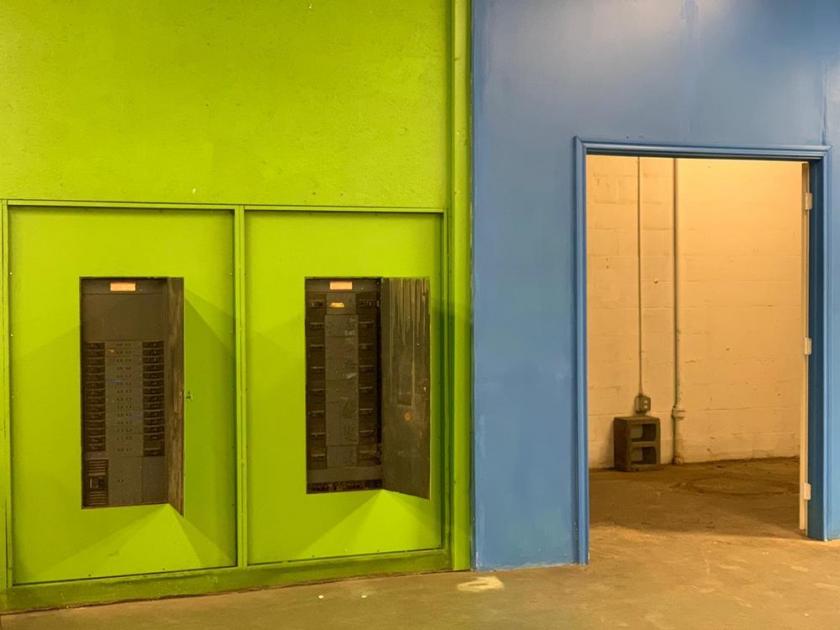
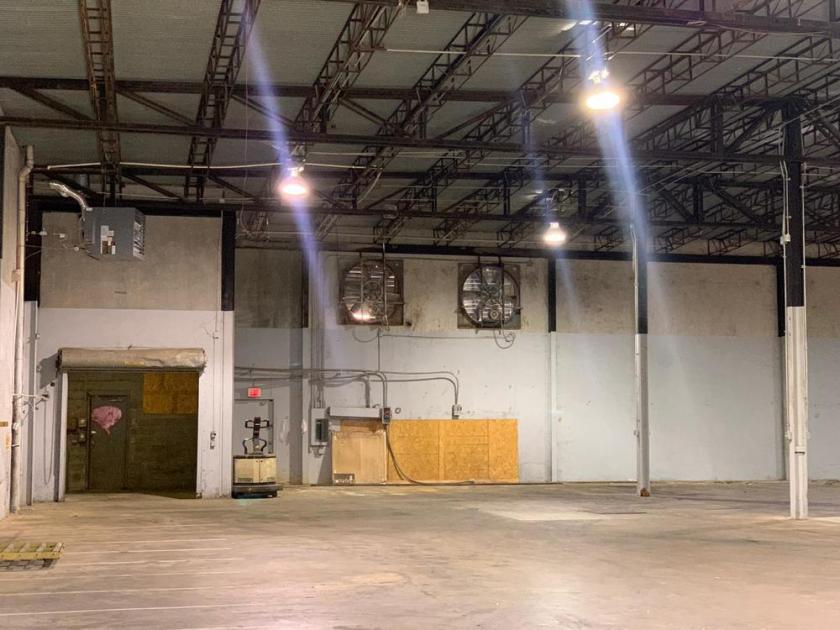
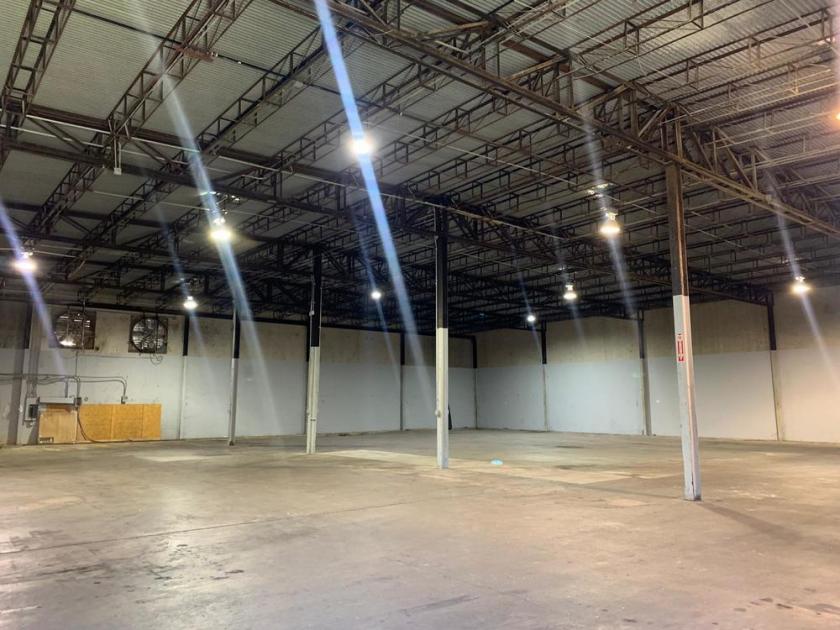
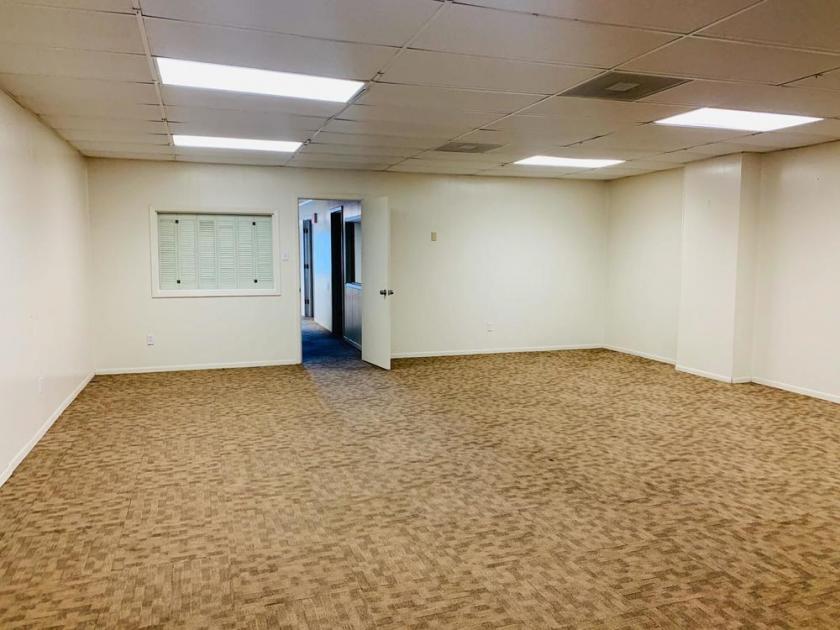
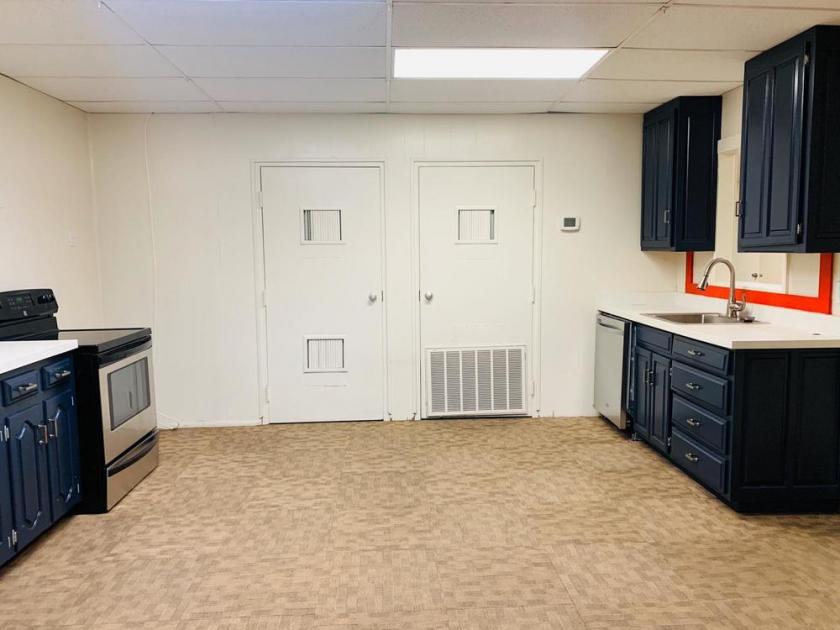
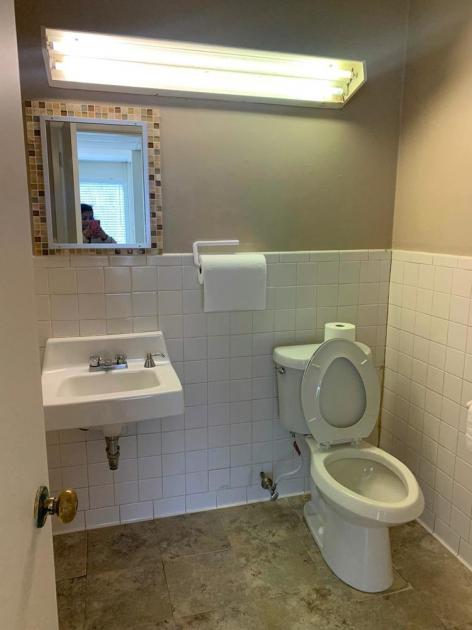
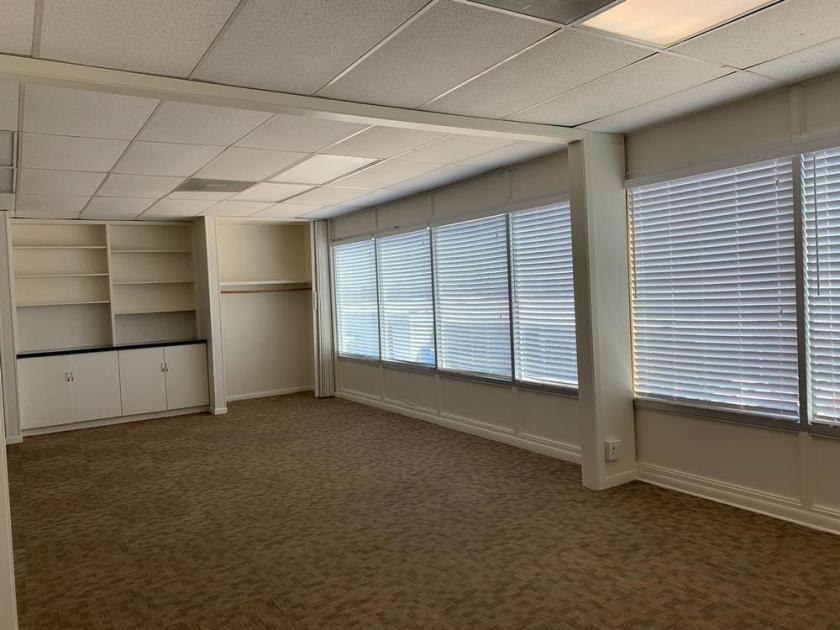
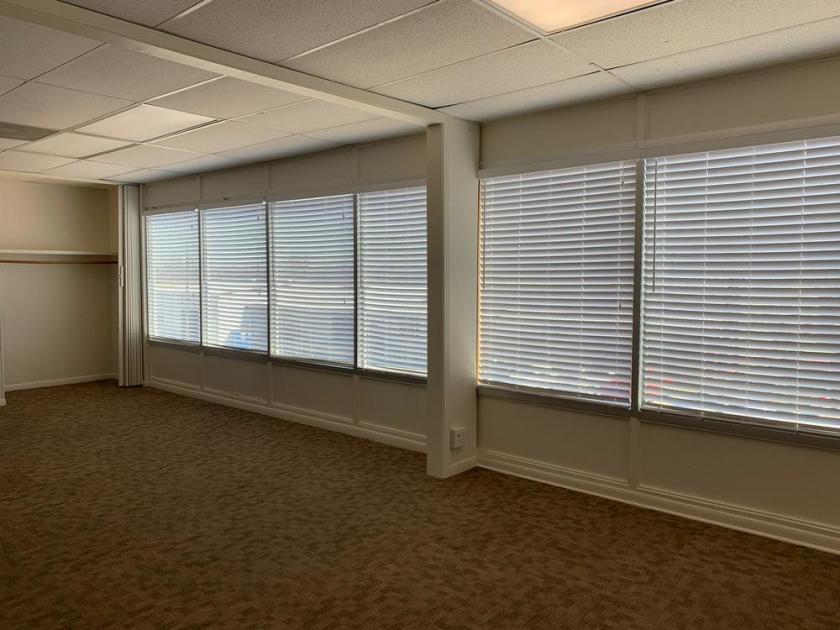
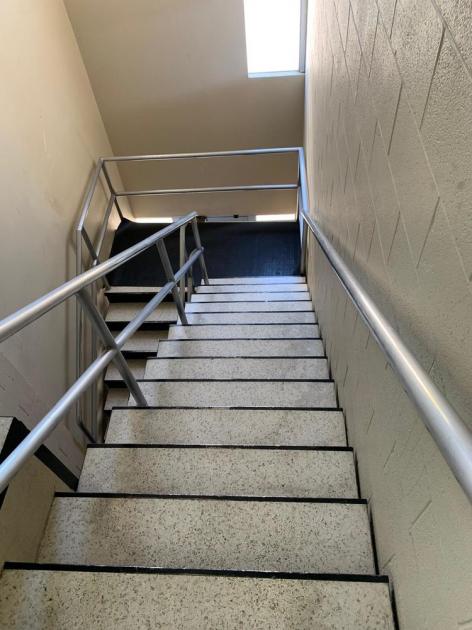
Additional Photos


Listing Agents

Durban Rohrbach
durban.rohrbach@svn.com
durban.rohrbach@svn.com
While we strive to provide the most accurate information, all listing information, and demographic data, is provided by third-parties. As such, MyEListing will not be responsible for the accuracy of the information. It is strongly recommended that you verify all information with the listing agent, and any relevant agencies, prior to making any decisions.