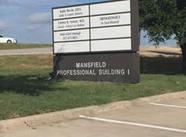
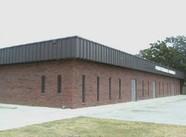
Description:
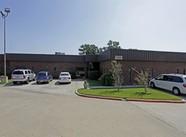
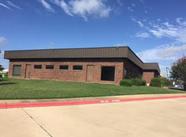
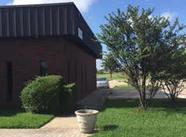
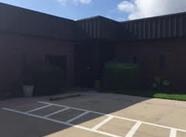
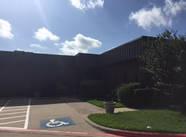
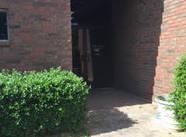
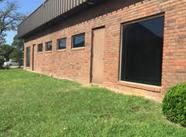
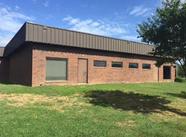
Mansfield Medical Office building with Highway 287 frontage available for lease. 11,000 square feet consisting of 7 office suites. Highway and Main Road access in the heart of Mansfield. Very close proximity to the new Hospital and the surrounding area has numerous restaurant and retail amenities, with more in development. The City of Mansfield is quickly expanding and developing with its rising population growth.
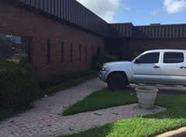
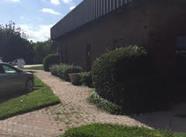
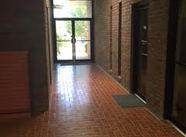
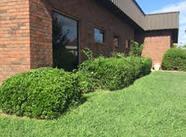
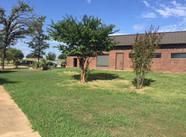
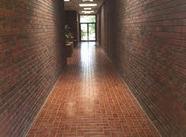
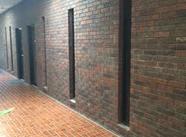
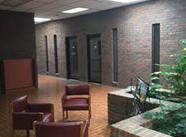
Multiple suite options and sizes are available with second generation Medical Office finish outs. Property operated by a local Property Management Company. Large renovated common area/waiting area. Great landscaping around the 1.35 acre property.
Location:
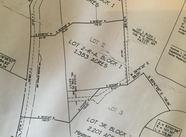
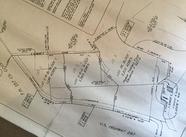
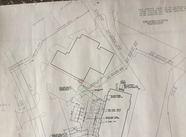
This property is located on the South East side of North US Highway 287 & Highway 157 in Mansfield, Texas 76063.
Highlights:
-Medical Office Building
-Intersection of HWY 157 & HWY 287
-11,000 SF Total in Building
-1.35 AC
-OPEX $3.50/SF
-Multiple Suite Options and Sizes Available
-Local Property Management
-Large Renovated Common Area/Waiting Area with Spanish Stone and Skylights
No part of this information may be copied, reproduced, repurposed, or screen-captured for any commercial purpose without prior written authorization from MyEListing.
While we strive to provide the most accurate information, all listing information, and demographic data, is provided by third-parties. As such, MyEListing will not be responsible for the accuracy of the information. It is strongly recommended that you verify all information with the listing agent, and any relevant agencies, prior to making any decisions.
What is the asking price for 1788 Farm to Market Road 157 in Mansfield?
The asking price for 1788 Farm to Market Road 157 is $16.00 a SF per Year
What is the building size of this commercial Office property?
The size of this lease property at '.1788 Farm to Market Road 157.' is 11000 square feet
What is the population within 1 mile of 1788 Farm to Market Road 157 in Mansfield?
The population within 1 mile of 1788 Farm to Market Road 157 Mansfield, TX 76063 is 9,547 people.
Who do I contact for questions about 1788 Farm to Market Road 157?
You should contact the listing agent,
Durban Rohrbach, for any details regarding this commercial listing.