Description:
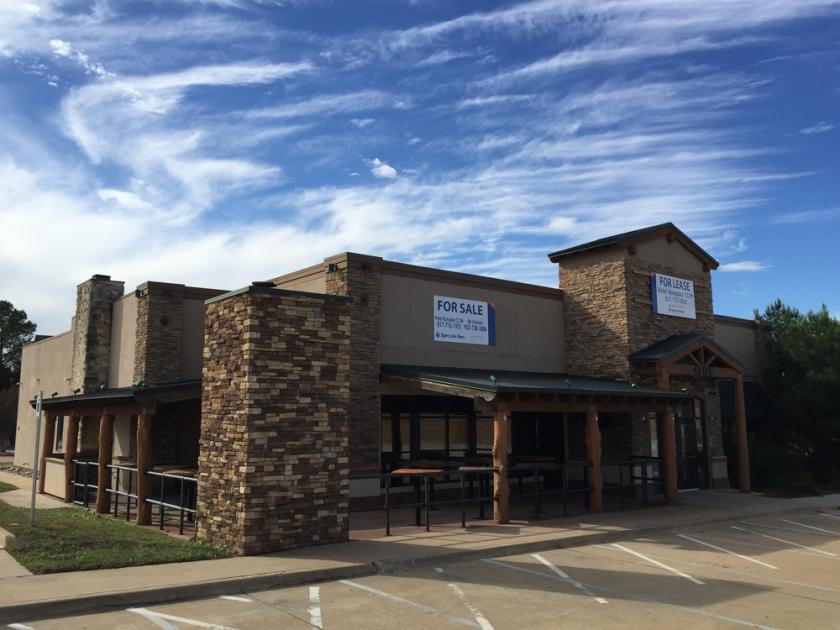
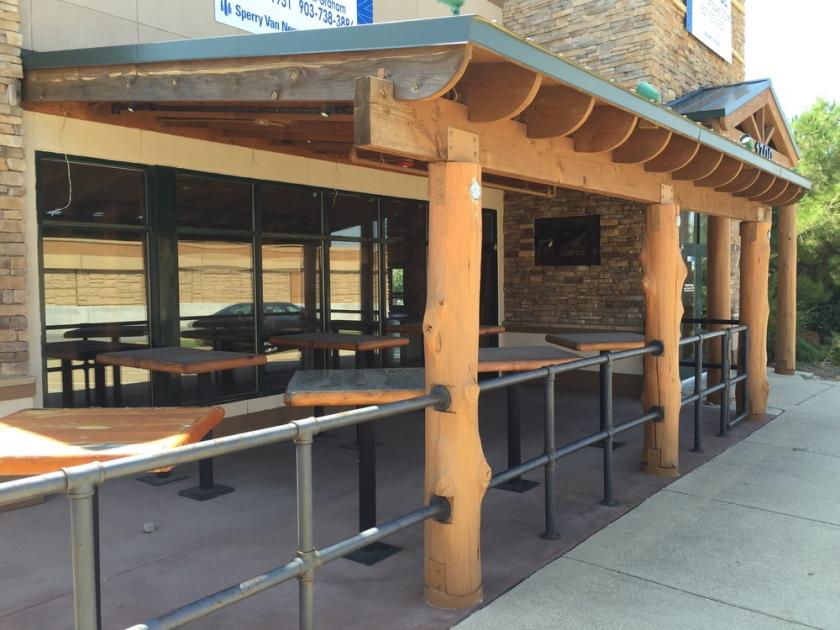
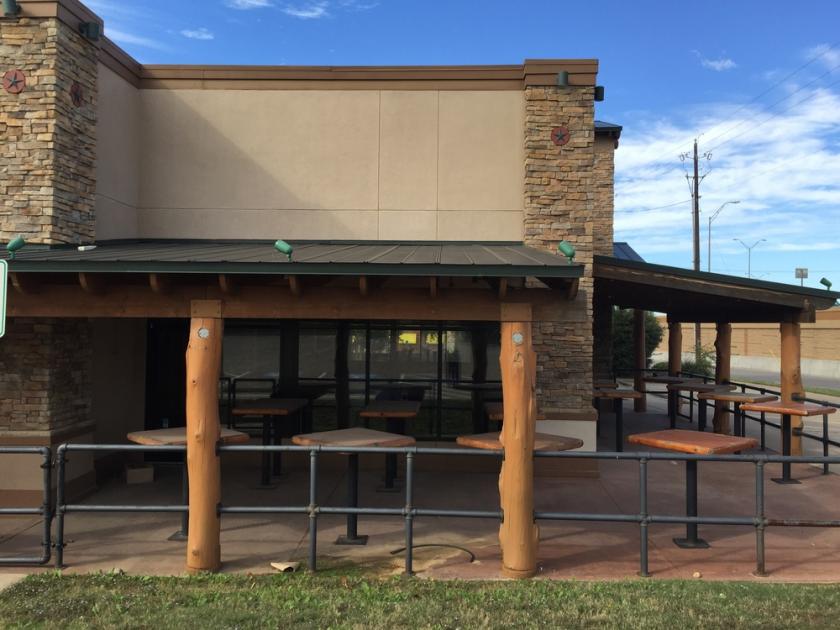
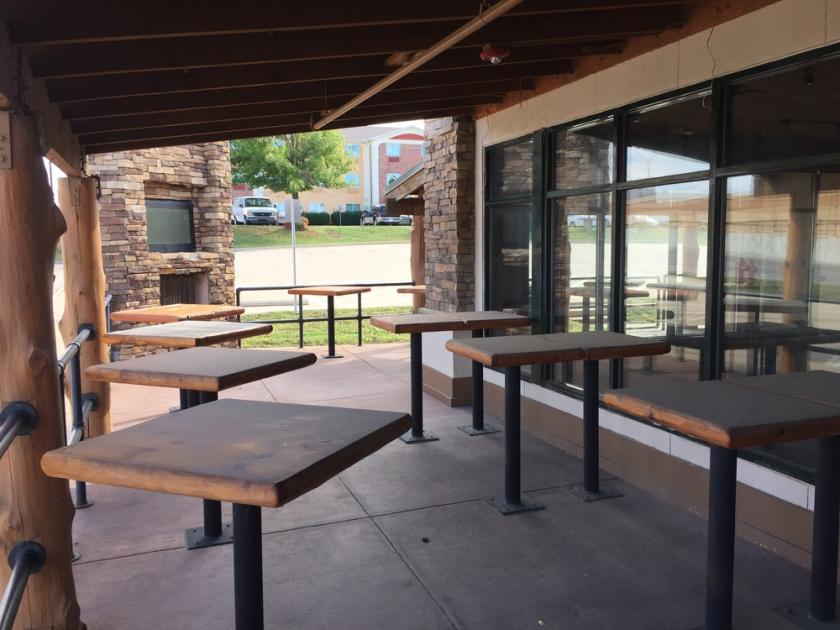
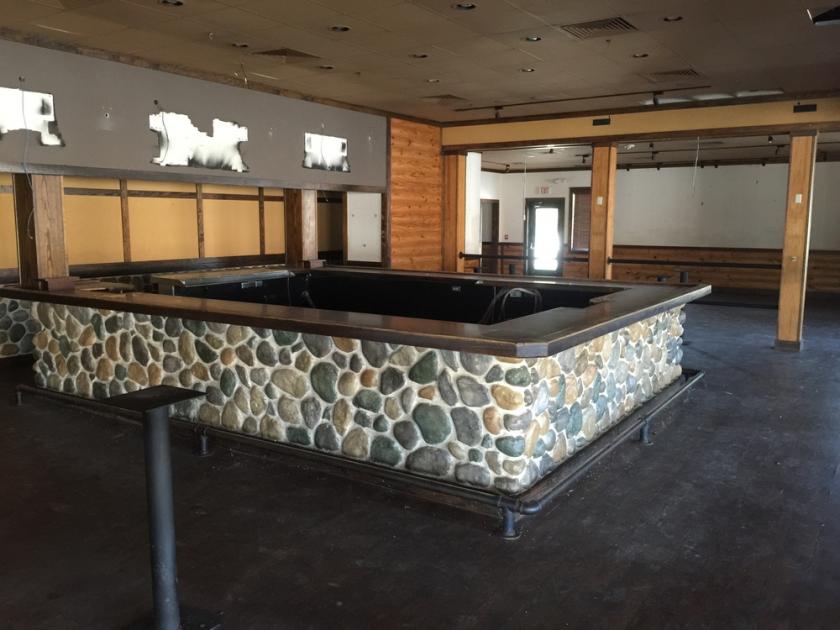
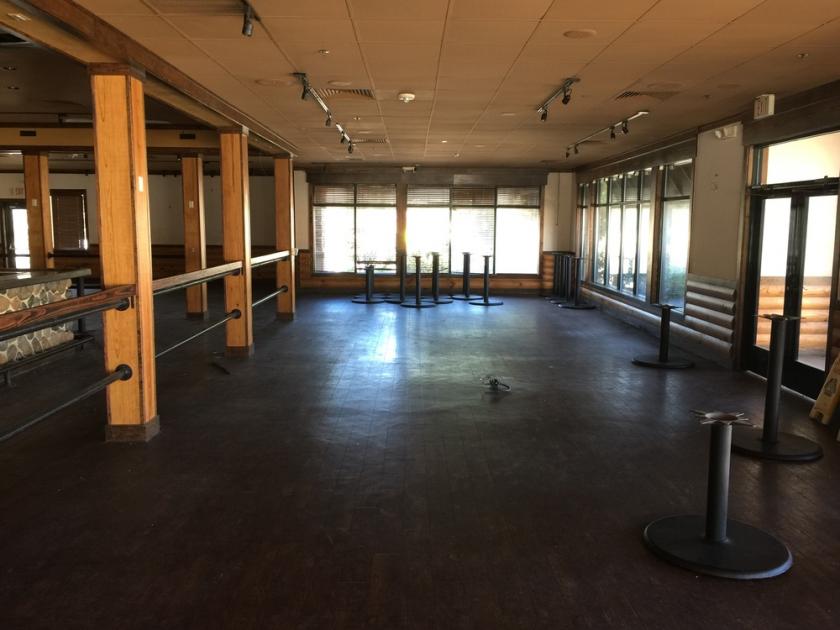
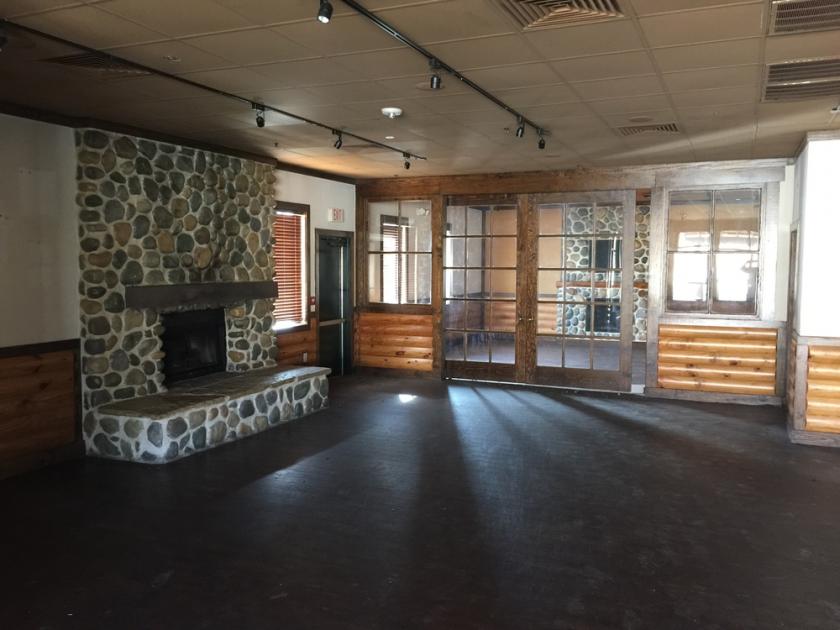
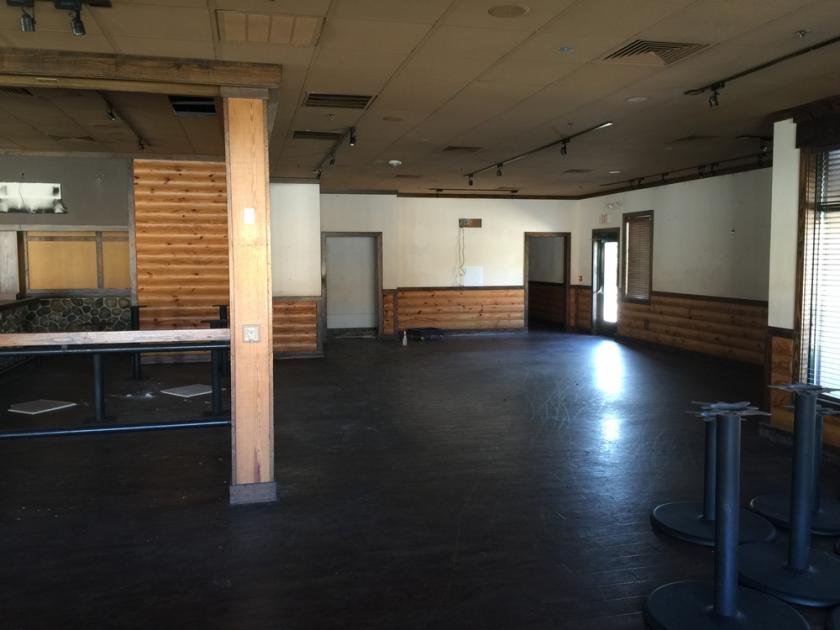
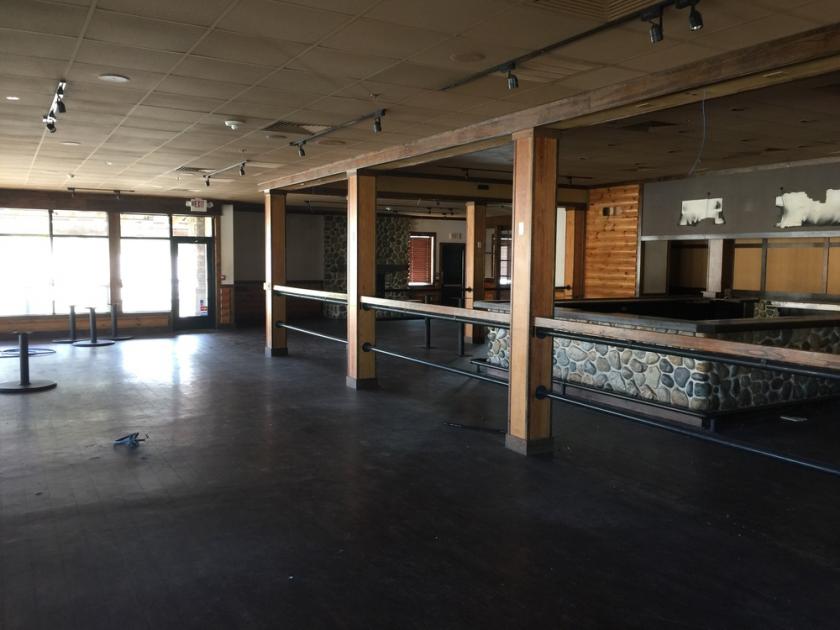
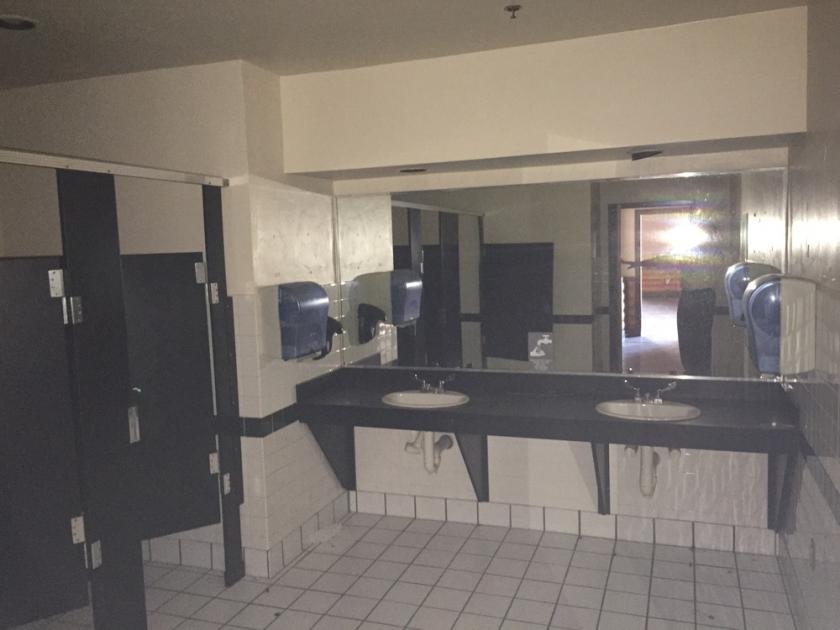
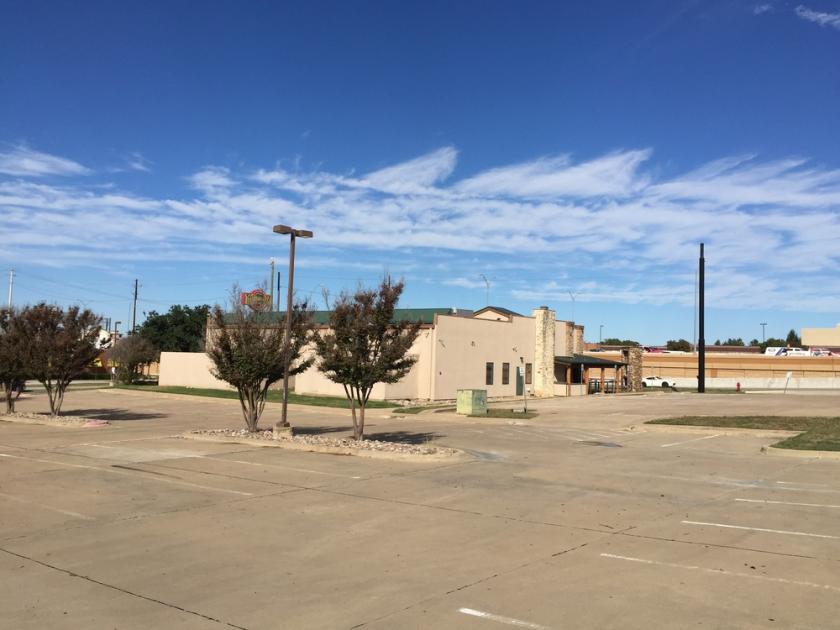
SVN-Dunn Commercial - Peter Konopka is pleased to present this stand alone retail/restaurant property to the market. Now with a big Price Reduction. The property consists of 6800 SF building situated on a 1.74 acre lot. The building was a former restaurant and some of the items remained. The restaurant offers both indoor and outdoor eating areas. Subzero freezers and other kitchen equipment in working condition. The building could be expended up to 10,000 SF and the usage could be changed very easily.
Location:
This freestanding 6,800 sqft restaurant building is situated on Highway 183 frontage in city of Bedford. Over 211,000 vpd traffic counts. There are many business near the intersection of Hwy 183 between Forest Ridge Dr. and Central Dr. It's close proximity to hospitality, retail, office and other restaurants make this location an ideal spot for either an owner/operated business or even an established franchise. The property is next door to former Fuddruckers Restaurant which should be converting to Goody Goody Liquor Store mid year 2020 and Super 8 Bedford Hotel. There is one way access from Hwy 183 frontage rd and two way access from Oak Creek Ln. The site has excellent visibility with great signage and super high traffic counts.
Highlights:
Huge Price Reduction
Former Restaurant
Great Location in the City of Bedford
Freestanding 6800 SF building
Highway Visibility with over 161,000 vpd traffic counts
Highway 183/121 Expansion Completed
Potential to expand the building to 10,000 SF
1.74 Acres Parcel of Land
No part of this information may be copied, reproduced, repurposed, or screen-captured for any commercial purpose without prior written authorization from MyEListing.
While we strive to provide the most accurate information, all listing information, and demographic data, is provided by third-parties. As such, MyEListing will not be responsible for the accuracy of the information. It is strongly recommended that you verify all information with the listing agent, and any relevant agencies, prior to making any decisions.
What is the asking price for 1700 Airport Freeway in Bedford?
The asking price for 1700 Airport Freeway is $1,090,000
What is the building size of this Retail property in Bedford, TX?
The size of the building/unit at 1700 Airport Freeway in Bedford is 6,800 square feet
How much land does the Bedford, TX property at 1700 Airport Freeway include?
1700 Airport Freeway in Bedford includes 1.740 acres of land
What is the population within 1 mile of 1700 Airport Freeway in Bedford?
The population within 1 mile of 1700 Airport Freeway Bedford, TX 76022 is 17,815 people.
Who do I contact for questions about 1700 Airport Freeway?
You should contact the listing agent,
Durban Rohrbach, for any details regarding this commercial listing.