Description:
This property is strategically close to the corner of Matlock Rd. and Country Club Drive. These two roads are major arteries to the city of Mansfield, with a high traffic count.
Office and retail properties have been fully built out on Matlock and Country Club Dr. This property sits right behind the successful and highly occupied retail and office.
This area in Mansfield supports upper end residential property owners. Other permitted uses include Hotel or Motel, Hospital/Home/Center for General, Acute or Chronic Care, Veterinarian Office, Church, Child Care Center, Elementary or Secondary School, Lodge or Civic Club. Mansfield C-2 ZONING DEVELOPMENT OPPORTUNITY (Section
4203 of Mansfield Zoning Ordinance).
Mansfield has been rated as one of the best places in the country to live and continues to grow at a rate higher than the already high growth the DFW Metroplex is experiencing. Currently, an additional 5,000 homes are planned and a lot of new rooftops are on the ground.
Location:
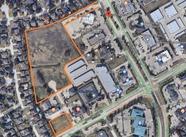
The property is at the corner of Matlock Rd. and Country Club Dr. 8.35 acres ready for development located between street frontage commercial and an established residential neighborhood. Excellent Ingress/Egress from Matlock Rd. and Alexis Ct. access directly into the property from Country Club Dr. The property is strategically located in a high traffic, upper demographic neighborhood. New development in the area has been well received and demonstrates a demand for additional development.
Highlights:
Infield land ready for development
Located in Mansfield, TX
2 points of entry for ingress and egress
property is level
No part of this information may be copied, reproduced, repurposed, or screen-captured for any commercial purpose without prior written authorization from MyEListing.
While we strive to provide the most accurate information, all listing information, and demographic data, is provided by third-parties. As such, MyEListing will not be responsible for the accuracy of the information. It is strongly recommended that you verify all information with the listing agent, and any relevant agencies, prior to making any decisions.
What is the asking price for 2261 Matlock Road in Mansfield?
The asking price for 2261 Matlock Road is $2,000,000
How much land does the Mansfield, TX property at 2261 Matlock Road include?
2261 Matlock Road in Mansfield includes 8.350 acres of land
What is the population within 1 mile of 2261 Matlock Road in Mansfield?
The population within 1 mile of 2261 Matlock Road Mansfield, TX 76063 is 12,786 people.
Who do I contact for questions about 2261 Matlock Road?
You should contact the listing agent,
Durban Rohrbach, for any details regarding this commercial listing.