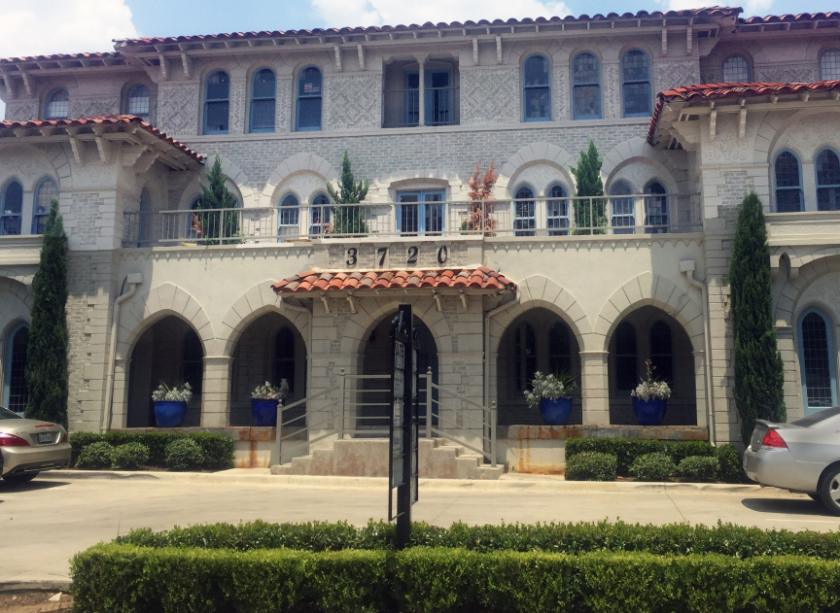
Office Space
3720 Rawlins St Dallas, TX 75219
3720 Rawlins St Dallas, TX 75219
Details & Description
Property Highlights
- • Building Class: B
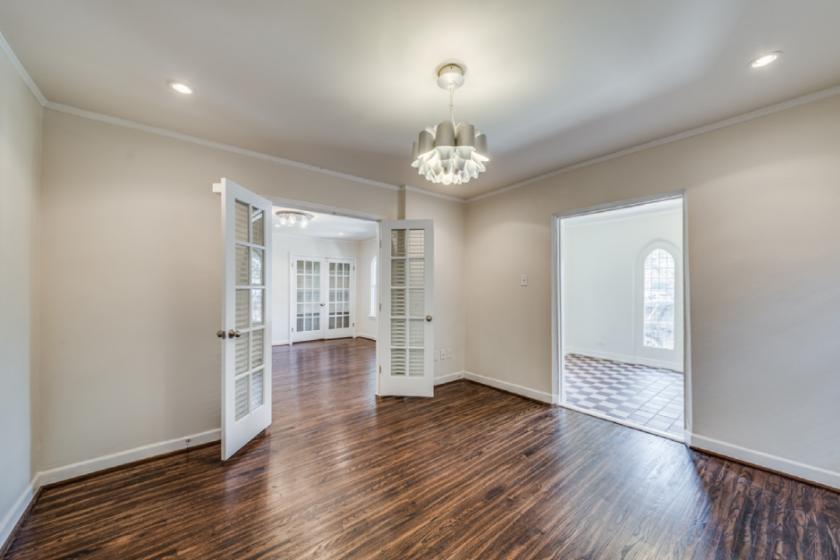
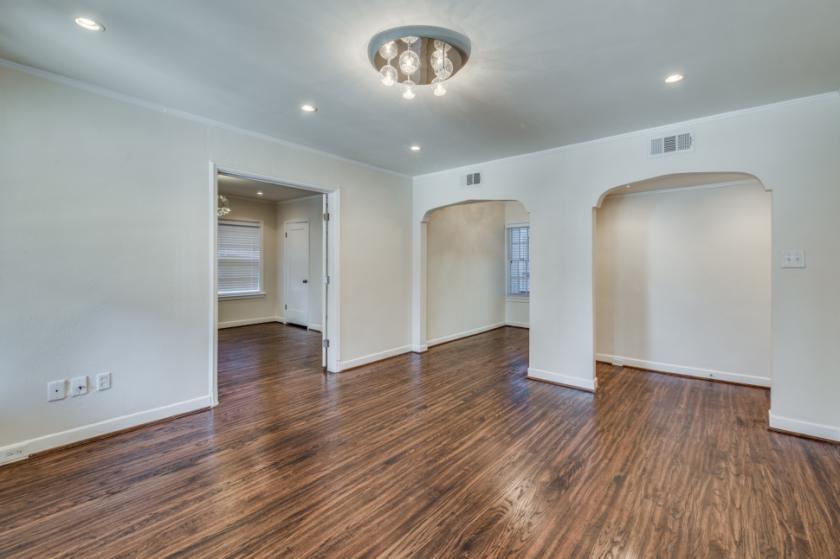
- • Move-In Ready
- • Private Restroom
- • Walkable to Oak Lawn & Uptown Areas
Additional Photos

Listing Agents

Jayson Montoya
O: 214-256-7136
M: 214-926-7347
jmontoya@nairl.com
O: 214-256-7136
M: 214-926-7347
jmontoya@nairl.com
While we strive to provide the most accurate information, all listing information, and demographic data, is provided by third-parties. As such, MyEListing will not be responsible for the accuracy of the information. It is strongly recommended that you verify all information with the listing agent, and any relevant agencies, prior to making any decisions.


