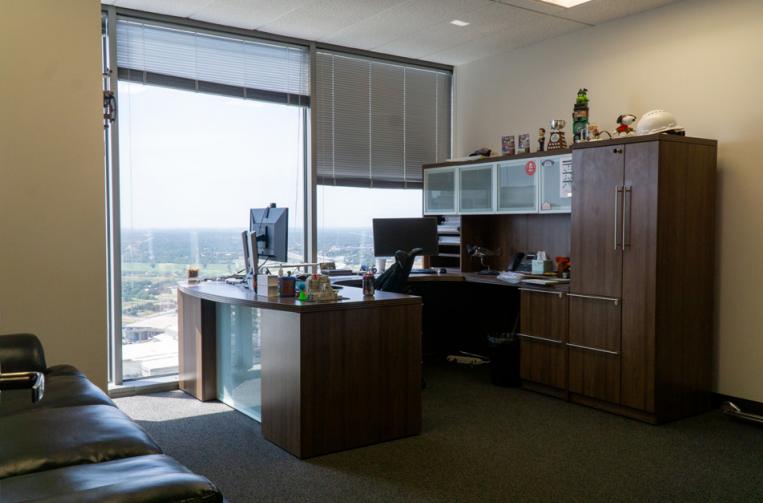
Office Space
1201 Elm St Dallas, TX 75270
1201 Elm St Dallas, TX 75270
Details & Description
Property Highlights
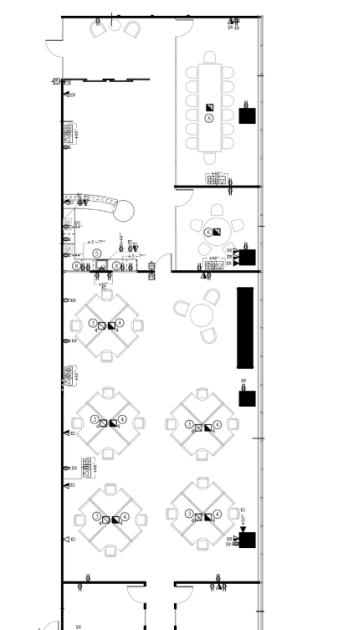
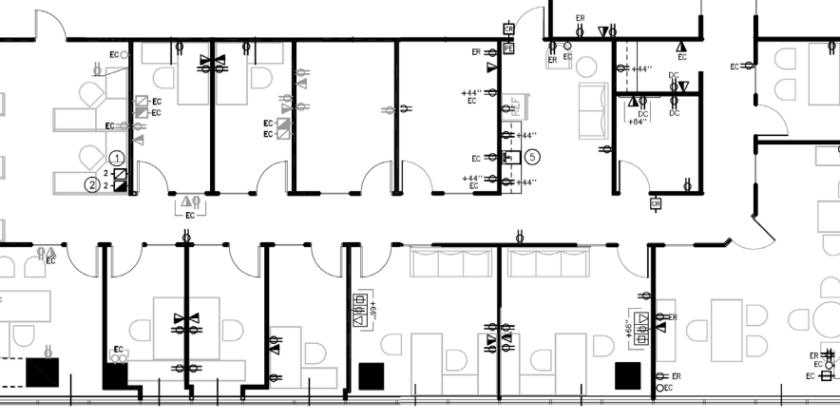
- • Suite 4250
- • Building Class: A
- • State-of-the-Art Fitness Center
- • Food Court/Starbucks On-Site
- • 7 Hotels Within Two Blocks
- • DART Acces
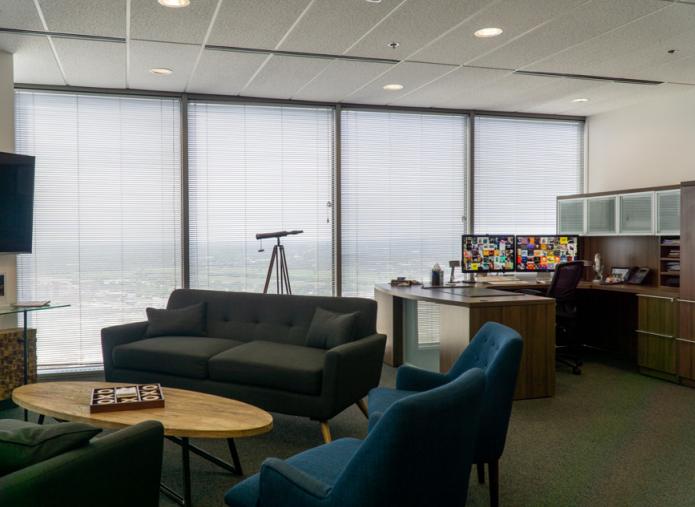
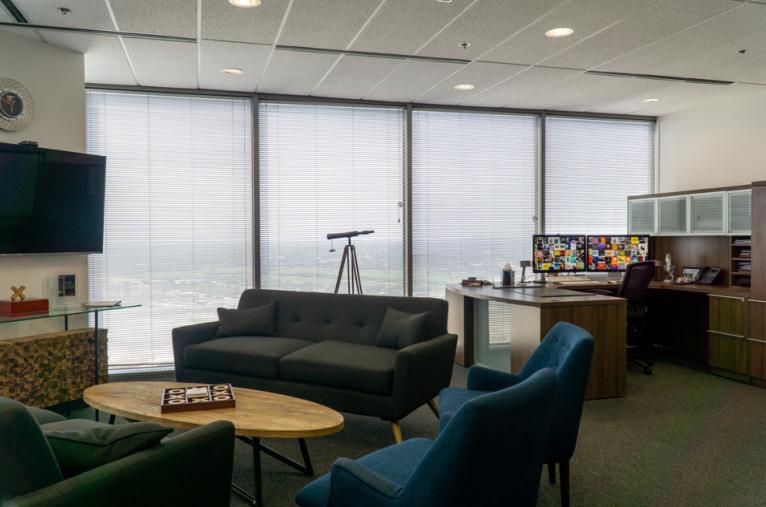
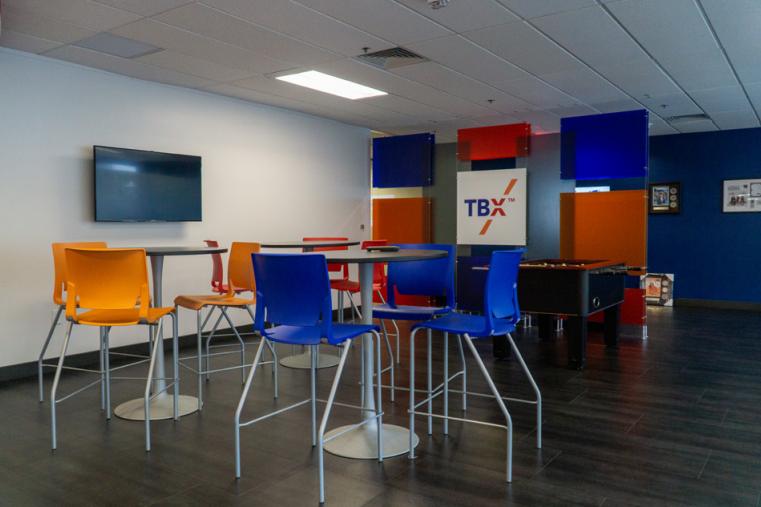
Additional Photos

Listing Agents

Jayson Montoya
O: 214-256-7136
M: 214-926-7347
jmontoya@nairl.com
O: 214-256-7136
M: 214-926-7347
jmontoya@nairl.com
While we strive to provide the most accurate information, all listing information, and demographic data, is provided by third-parties. As such, MyEListing will not be responsible for the accuracy of the information. It is strongly recommended that you verify all information with the listing agent, and any relevant agencies, prior to making any decisions.