Flex-Office-Warehouse
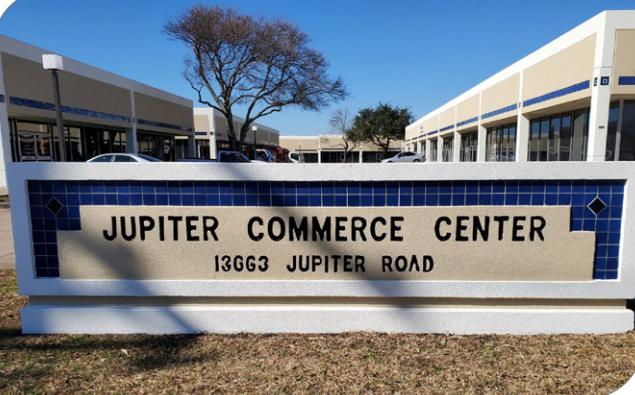
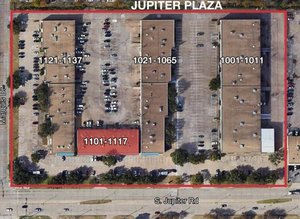
13663 Jupiter Rd Building 4 Dallas, TX 75238
13663 Jupiter Rd Building 4 Dallas, TX 75238
Details & Description
Property Highlights
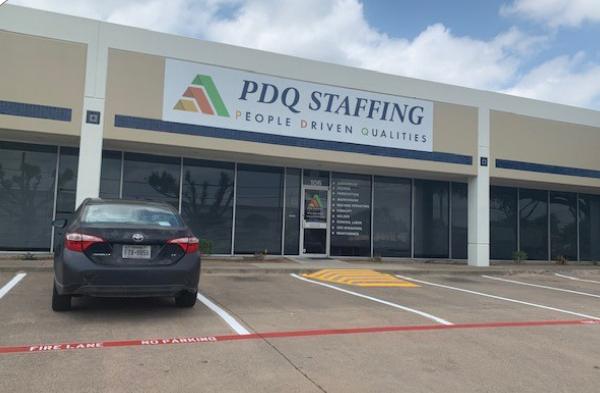
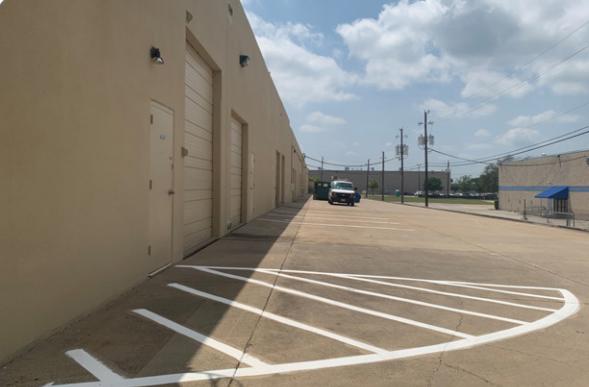
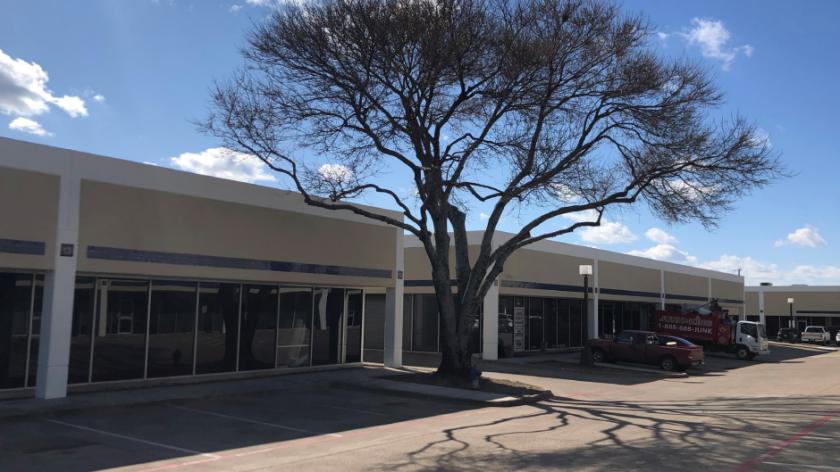
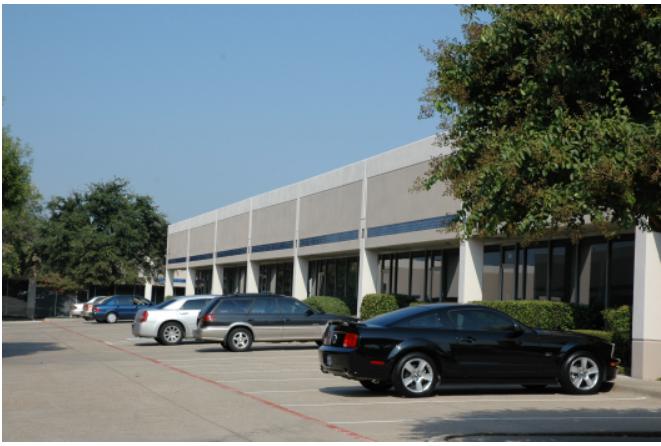
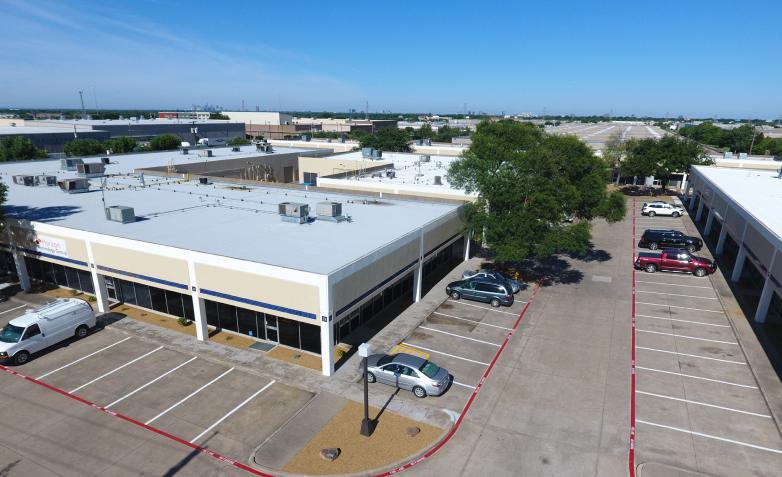
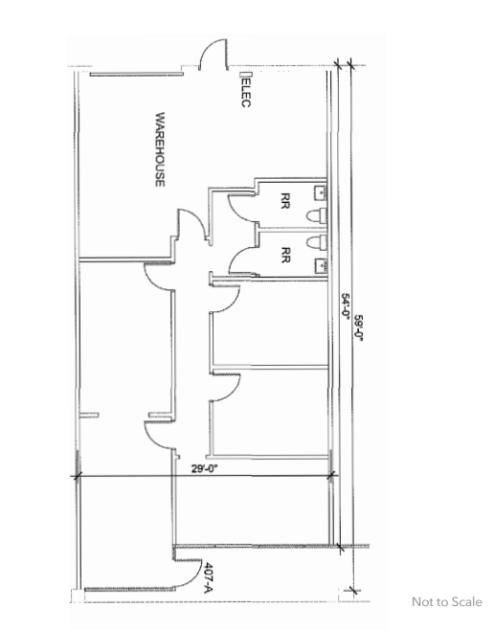
- • High-Image Industrial Warehouse & Flex Suites
- • Ground Level Loading
- • Central Dallas Location
- • Convenient Access to I-635 and I-30 Freeways
- • Professional Management
- • Well Maintained Business Park
Additional Photos


Listing Agents

Stephen Cooper
O: 214-256-7160
M: 214-497-0730
scooper@nairl.com
O: 214-256-7160
M: 214-497-0730
scooper@nairl.com

Andrew Shaw
M: 214-708-2797
ashaw@nairlretail.com
M: 214-708-2797
ashaw@nairlretail.com
While we strive to provide the most accurate information, all listing information, and demographic data, is provided by third-parties. As such, MyEListing will not be responsible for the accuracy of the information. It is strongly recommended that you verify all information with the listing agent, and any relevant agencies, prior to making any decisions.